Step 1.
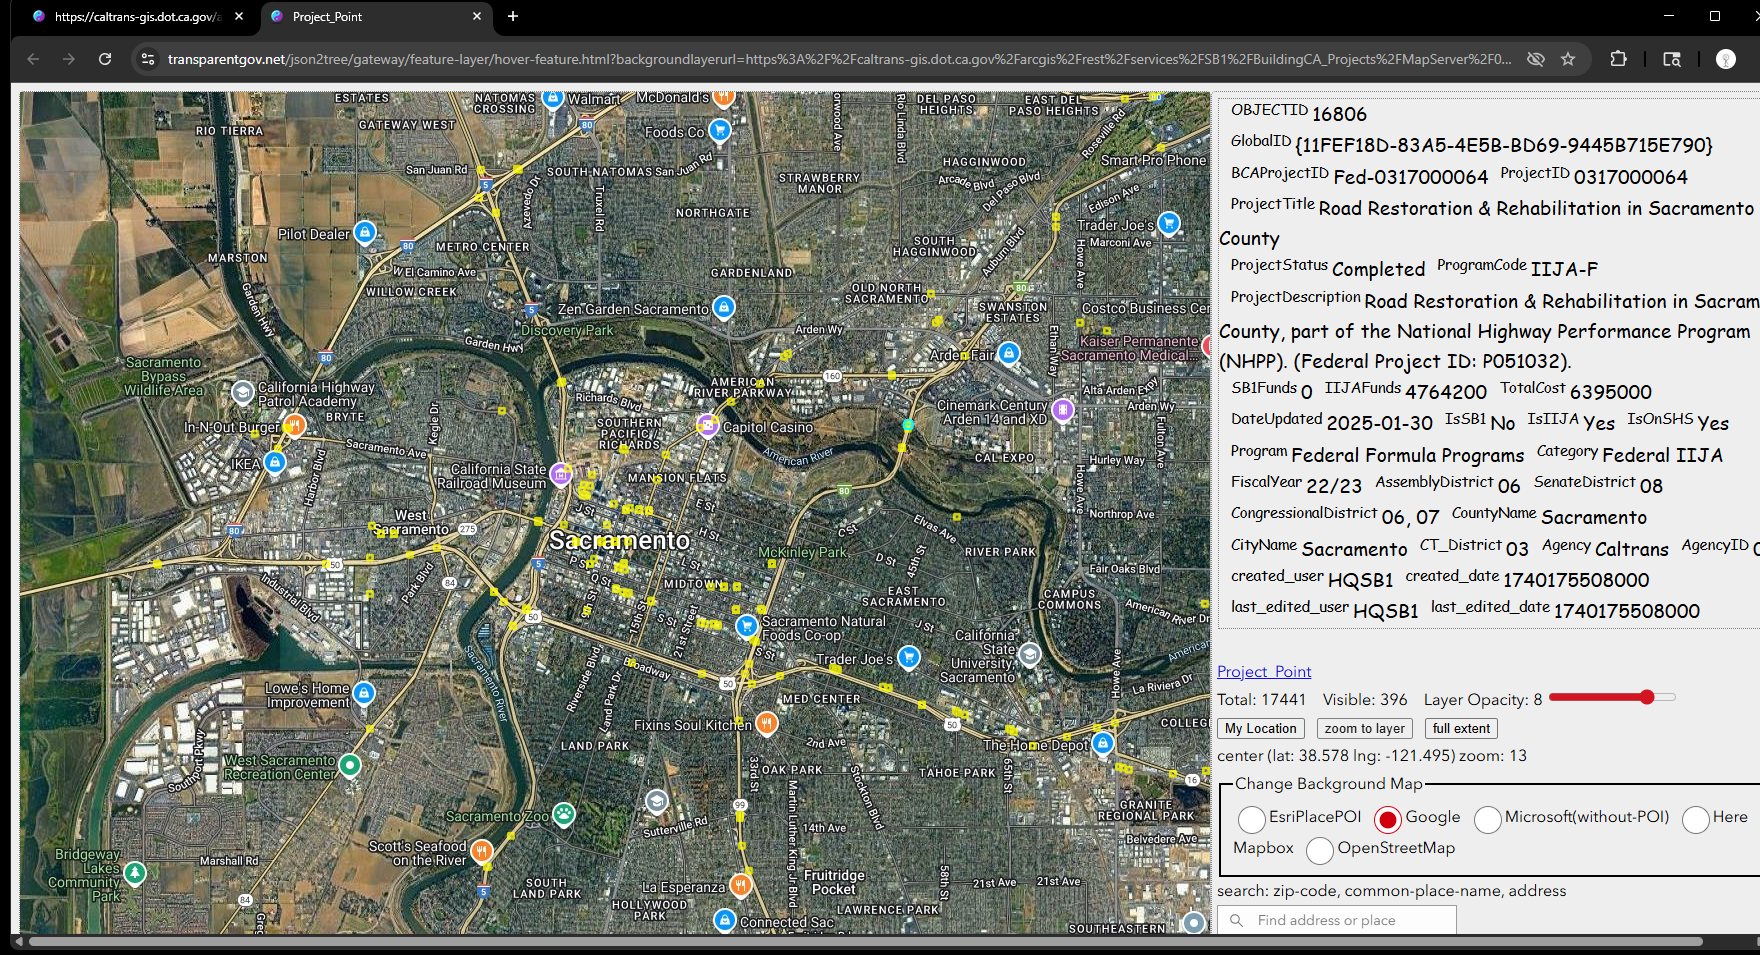
This map show all catrans projects
use latest arcgis javascript SDK v4.33, web component, remove old esri widget
https://transparentgov.net/json2tree/gateway/feature-layer/hover-feature.html?backgroundlayerurl=https%3A%2F%2Fcaltrans-gis.dot.ca.gov%2Farcgis%2Frest%2Fservices%2FSB1%2FBuildingCA_Projects%2FMapServer%2F0&layer=Project_Point&_center_lat=38.57779205225711&_center_long=-121.49522391470757&_center_zoom=13&panto=0
Step 2.
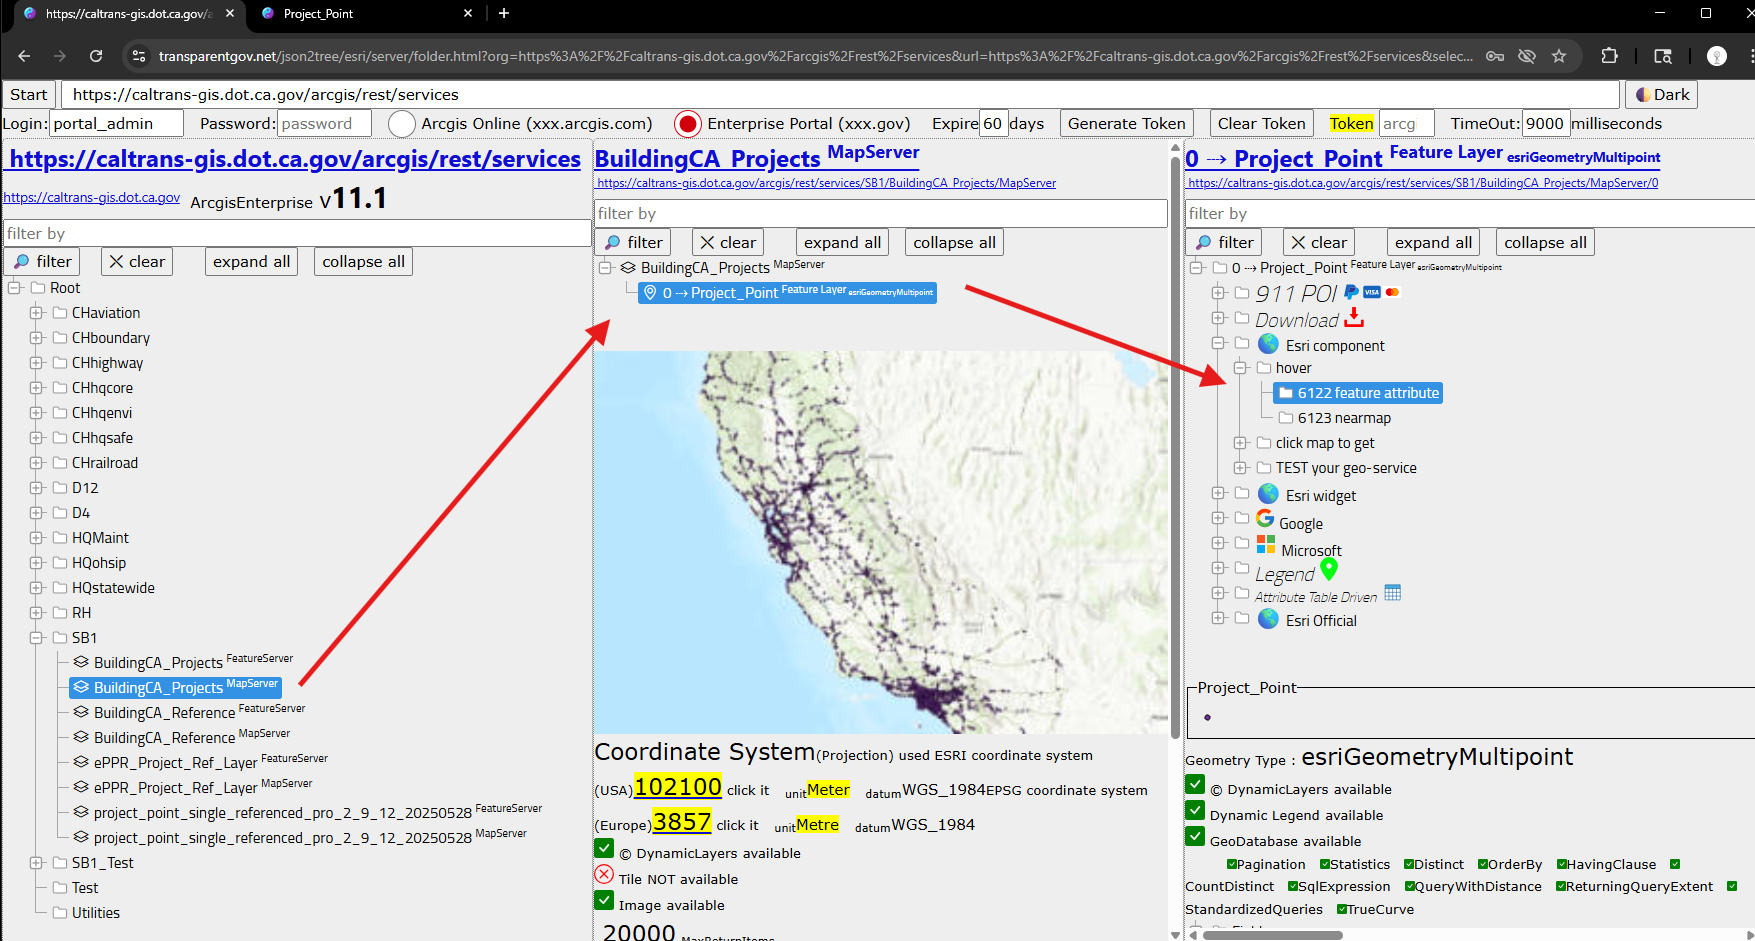
project layers is here
https://transparentgov.net/json2tree/esri/server/folder.html?org=https%3A%2F%2Fcaltrans-gis.dot.ca.gov%2Farcgis%2Frest%2Fservices&url=https%3A%2F%2Fcaltrans-gis.dot.ca.gov%2Farcgis%2Frest%2Fservices&select_folder=25&select_layer=0&arcgis_online_token=&select_folder_text=BuildingCA_Projects+%3Csup%3EMapServer%3C%2Fsup%3E&select_layer_text=0+%26%23x21E2%3B+Project_Point+%3Csup%3EFeature+Layer%3Csub%3E+esriGeometryMultipoint%3C%2Fsub%3E%3C%2Fsup%3E
Step 3.
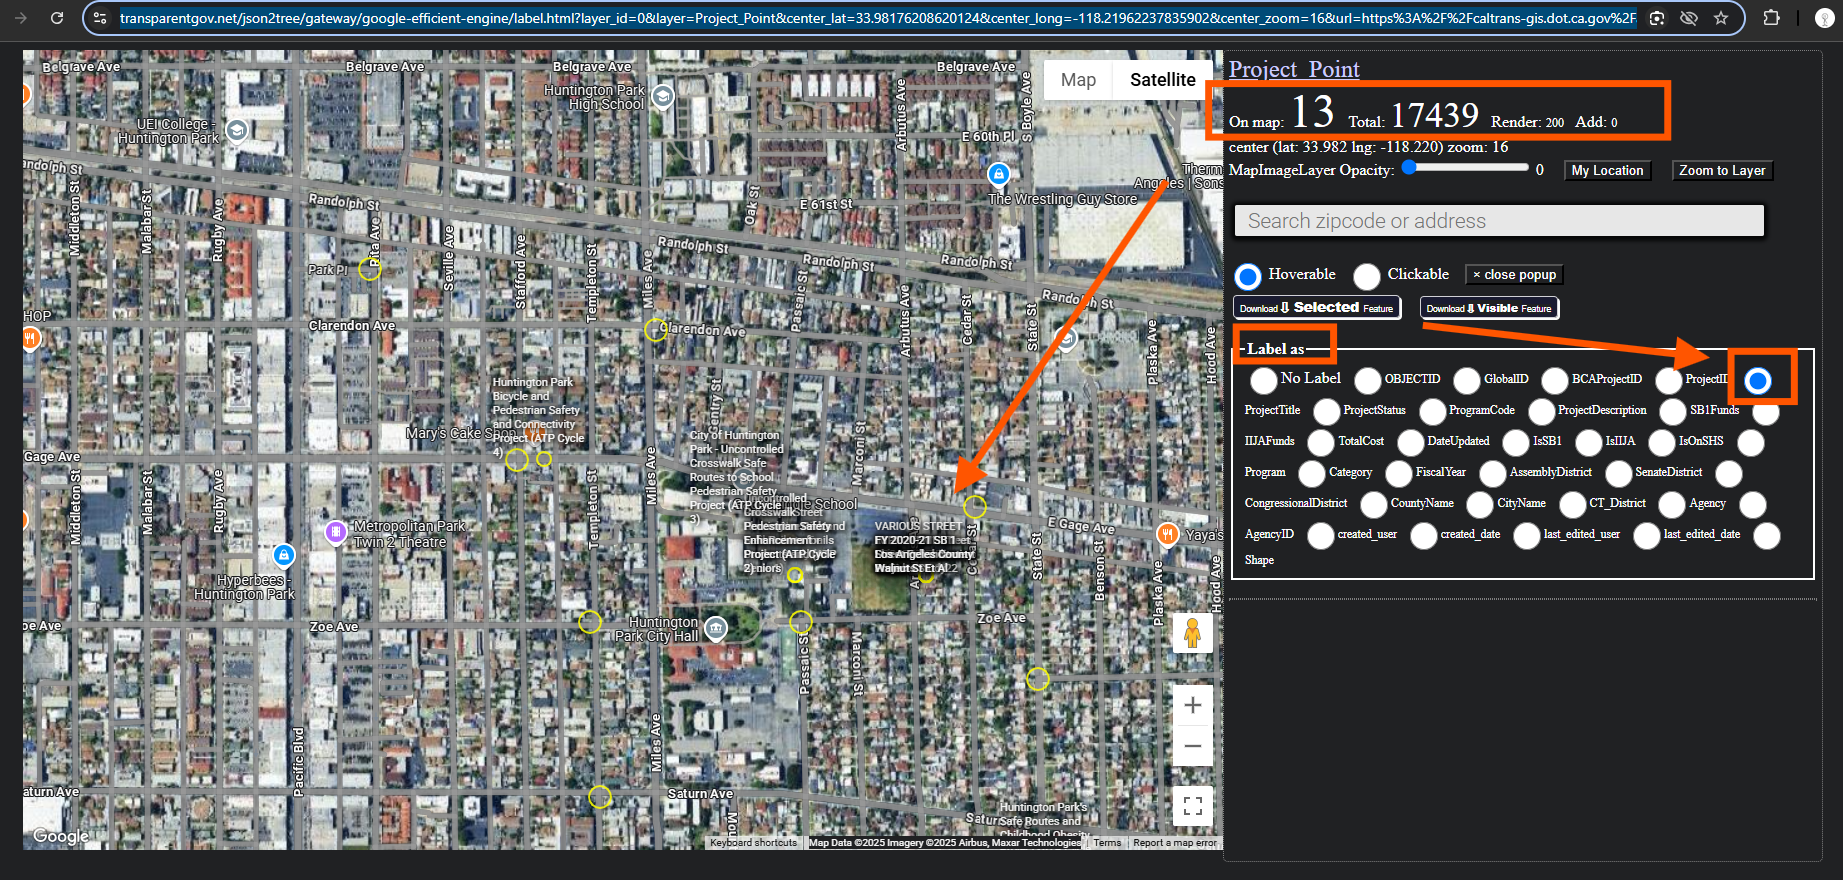
another model to see the same projects layer
https://transparentgov.net/json2tree/gateway/google-efficient-engine/label.html?layer_id=0&layer=Project_Point¢er_lat=33.98176208620124¢er_long=-118.21962237835902¢er_zoom=16&url=https%3A%2F%2Fcaltrans-gis.dot.ca.gov%2Farcgis%2Frest%2Fservices%2FSB1%2FBuildingCA_Projects%2FMapServer&panto=0&labelAsField=ProjectTitle
Step 4.
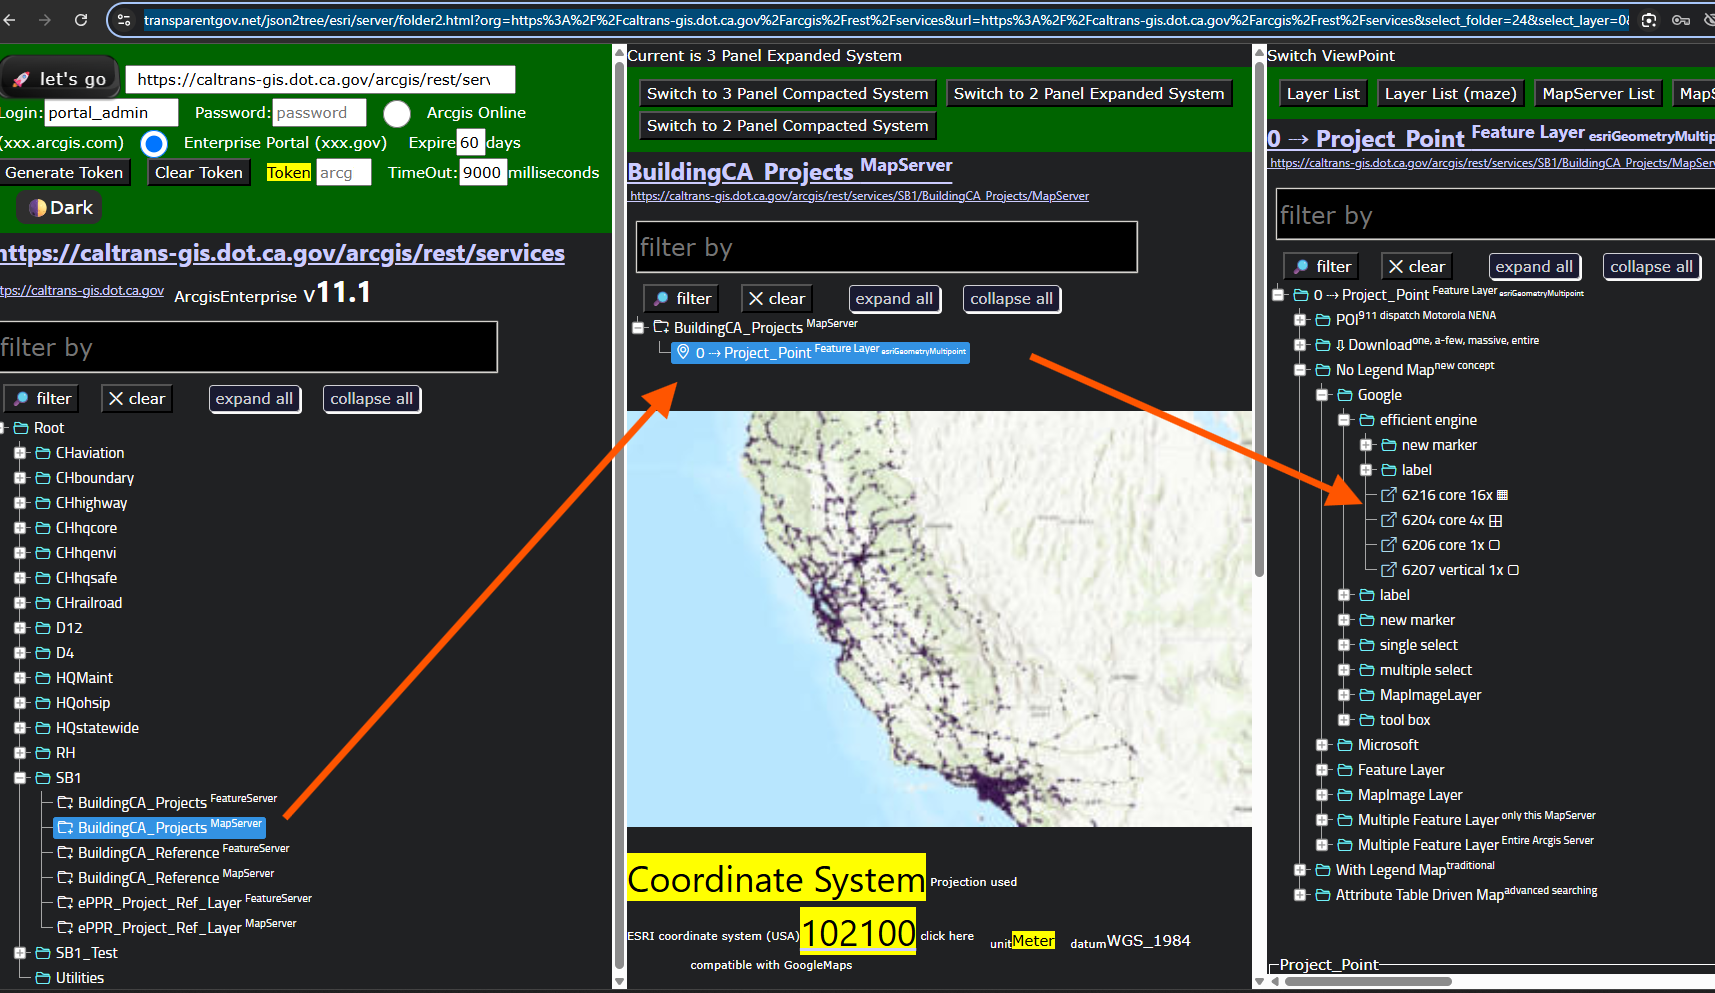
REST api endpoint
https://caltrans-gis.dot.ca.gov/arcgis/rest/services
SB1 project point layer
https://transparentgov.net/json2tree/esri/server/folder2.html?org=https%3A%2F%2Fcaltrans-gis.dot.ca.gov%2Farcgis%2Frest%2Fservices&url=https%3A%2F%2Fcaltrans-gis.dot.ca.gov%2Farcgis%2Frest%2Fservices&select_folder=24&select_layer=0&arcgis_online_token=&select_folder_text=BuildingCA_Projects+%3Csup%3EMapServer%3C%2Fsup%3E&select_layer_text=0+%26%23x21E2%3B+Project_Point+%3Csup%3EFeature+Layer%3Csub%3E+esriGeometryMultipoint%3C%2Fsub%3E%3C%2Fsup%3E
Step 5.
all playground has no third party css style, only plain HTML for easy inherit css style from your existing parent website.
Simple Design is beauty
This playground has fixed screen size (width1200px height 800px). It will fit into any of your existing website
The reason I don't preserve Original symbology from arcgis pro
is because Original symbology has too much color and shape result in a mess in the point view from public user.
For Original symbology preserved from arcgis pro check out other model number not list here.
Therefore, I removed all color symbology, removed all legend. All project, no matter its type, original funding, they are all present as yellow line or yellow square for point.
In public user's point of view, as long as they see yellow things, it is a funding project, regardless it is a line or point or funding type
Step 6.
Caltrans all projects Points only show millions of dollars on top when you hover or click, only show project description at bottom
https://transparentgov.net/json2tree/datahub.io/caltrans/featurelayer.html?backgroundlayerurl=https%3A%2F%2Fcaltrans-gis.dot.ca.gov%2Farcgis%2Frest%2Fservices%2FSB1%2FBuildingCA_Projects%2FMapServer%2F0&_center_lat=40.18202309350921&_center_long=-119.73678796025737&_center_zoom=8&panto=0&clickorhover=hover&layer=Project_Point
Step 7.
(removed 2025, all line merge into point layer)Caltrans all projects lines only show millions of dollars on top when you hover or click, only show project description at bottom
https://transparentgov.net/json2tree/datahub.io/caltrans/featurelayer.html?backgroundlayerurl=https%3A%2F%2Fcaltrans-gis.dot.ca.gov%2Farcgis%2Frest%2Fservices%2FSB1%2FBuildingCA_Projects%2FMapServer%2F1&_center_lat=40.18202309350921&_center_long=-119.73678796025737&_center_zoom=8&panto=0&clickorhover=hover&layer=Project_Line