If you show multiple layers at same time, your map will become messy.
The more layers you give to user, the less information user will absorb.
Messy map is useless, very little information can be absorbed.
Let's see how Los Angeles county solve this problem using story map.
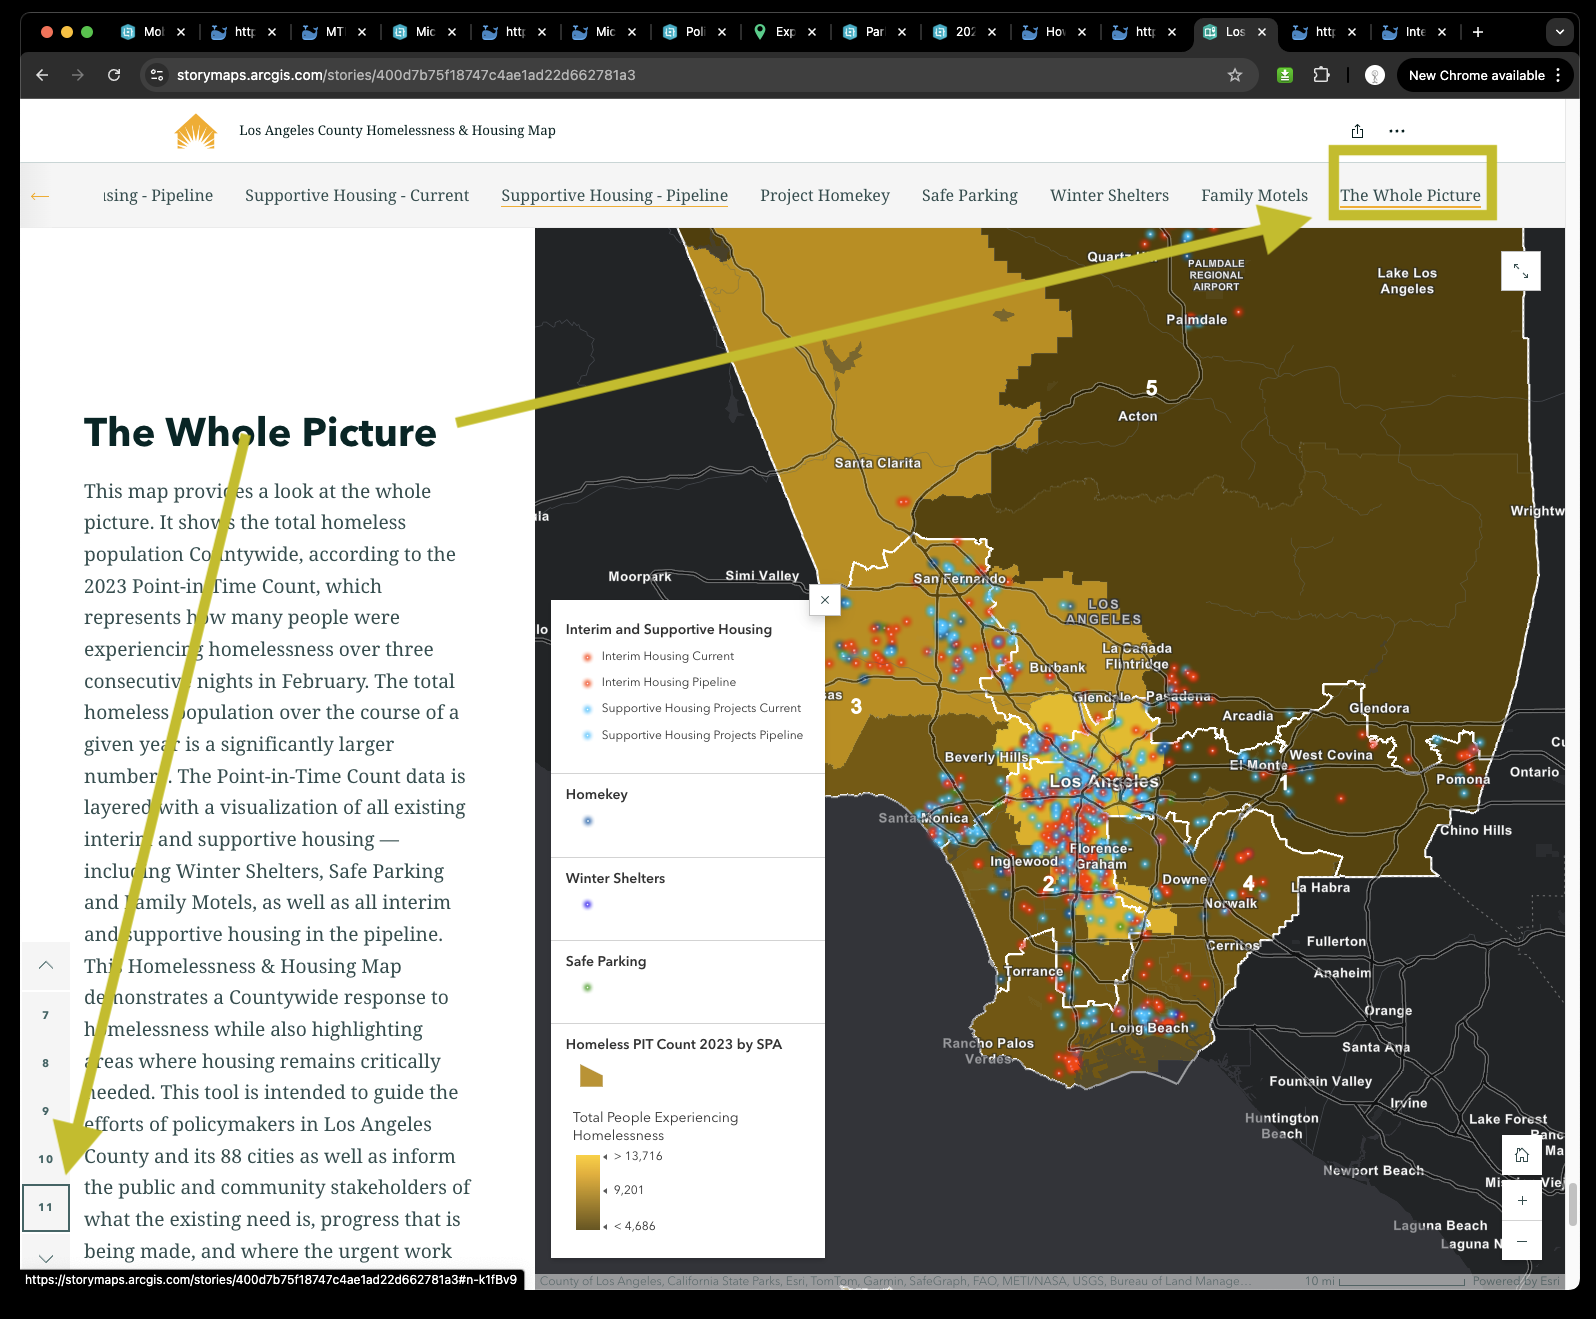
This story map, page 11, the last page is whole picture, it includes all 6+ layers, other page are just showing 1 layer at a time.
https://storymaps.arcgis.com/stories/400d7b75f18747c4ae1ad22d662781a3
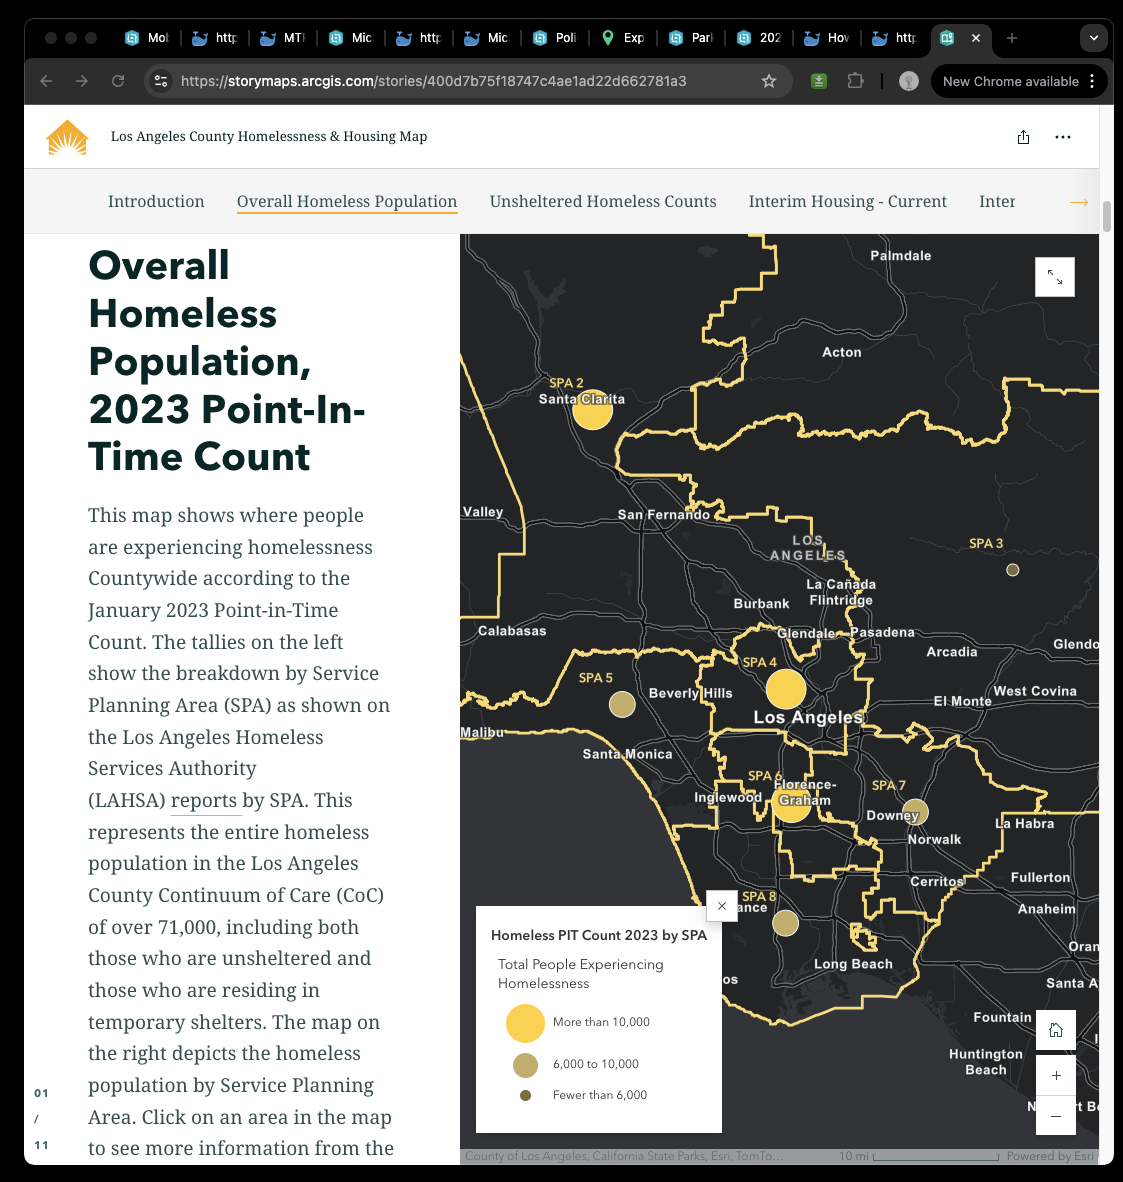
This is single layer by itself, very simple point layer, user can absorb the most of it.
https://services.arcgis.com/RmCCgQtiZLDCtblq/arcgis/rest/services/Interim_and_Supportive_Housing_Projects___Map__Story_Map_Part_1__V2_WFL1/FeatureServer/3
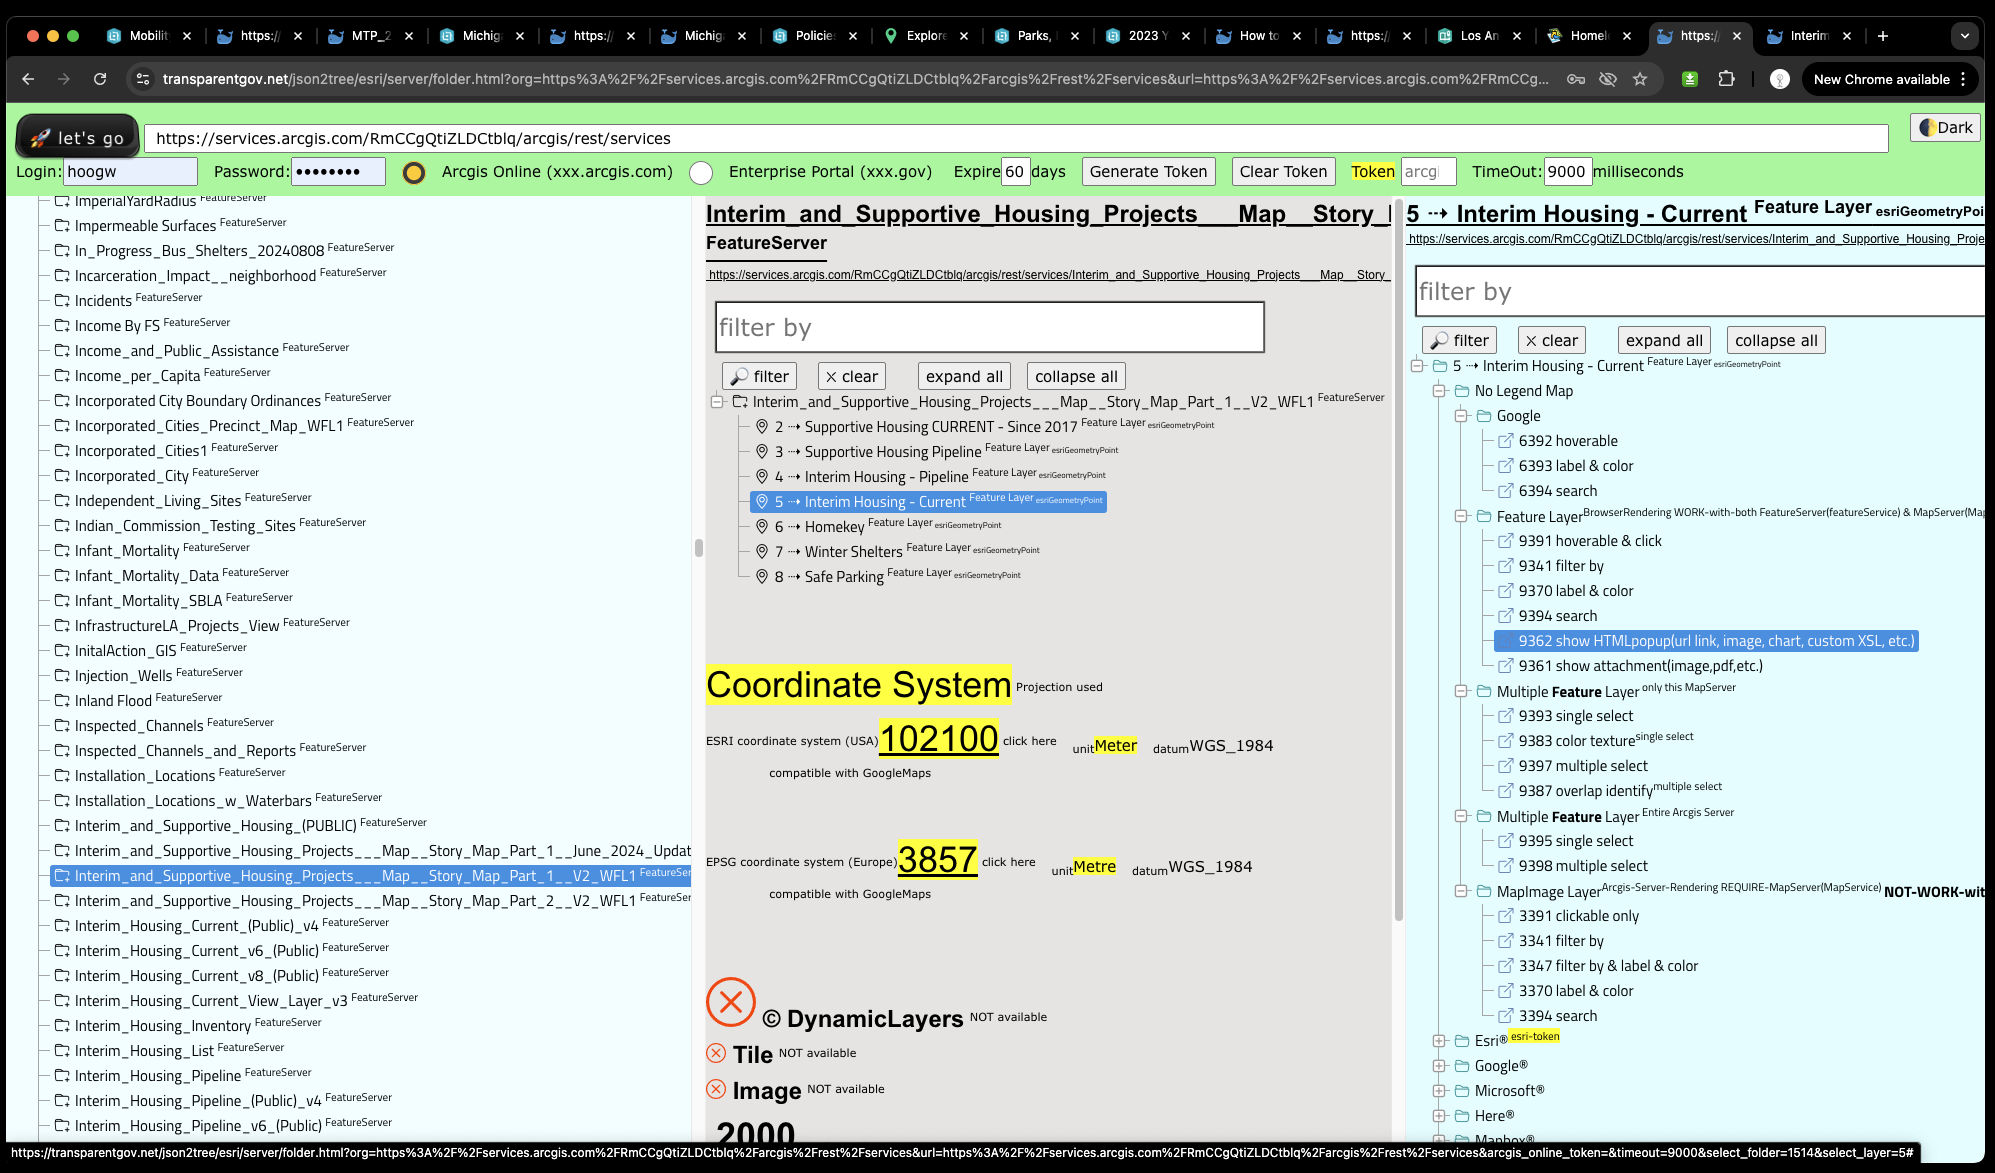
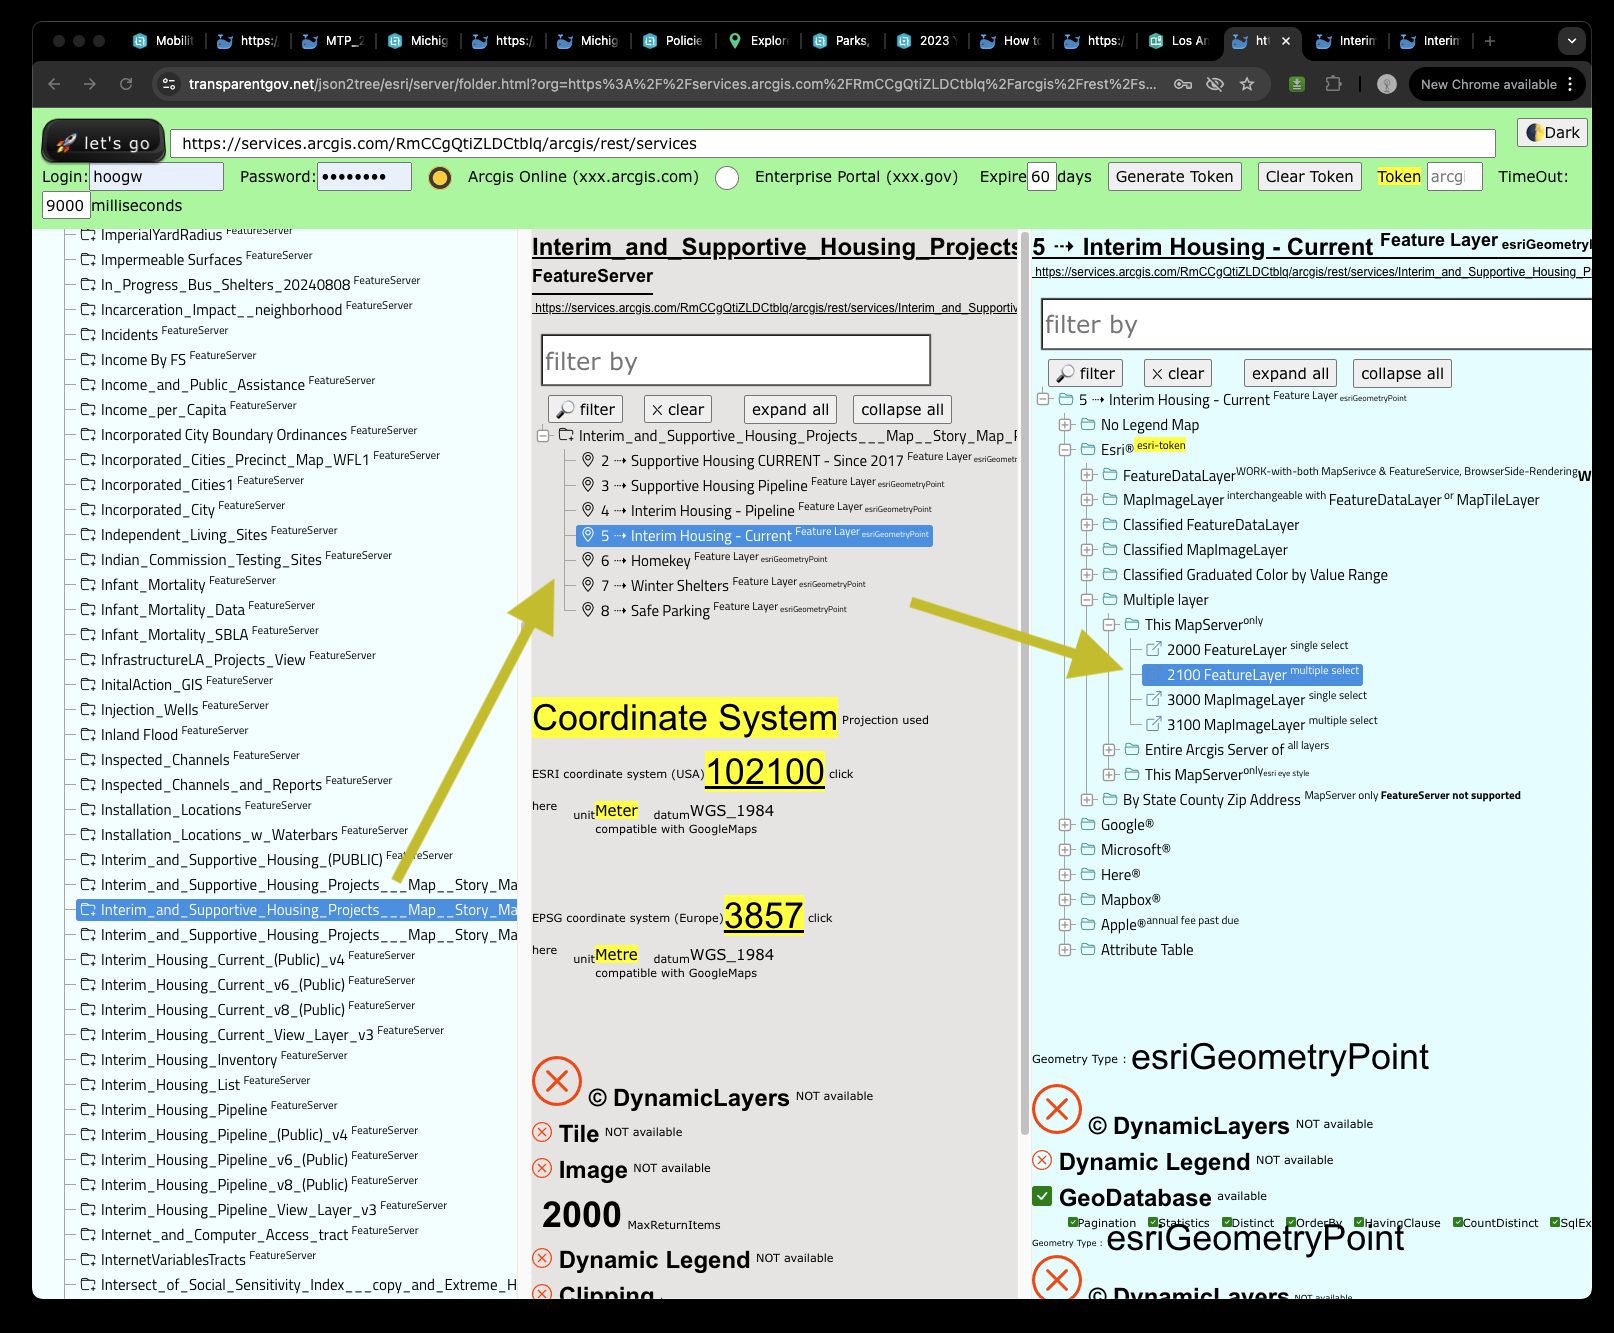
All layers is on the same Mapserver, see pic
Due to very large amount of data on this REST api endpoint, you need to increase the response time limit from 1 second to 9 sec
https://transparentgov.net/json2tree/esri/server/folder.html?org=https%3A%2F%2Fservices.arcgis.com%2FRmCCgQtiZLDCtblq%2Farcgis%2Frest%2Fservices&url=https%3A%2F%2Fservices.arcgis.com%2FRmCCgQtiZLDCtblq%2Farcgis%2Frest%2Fservices&arcgis_online_token=&timeout=9000
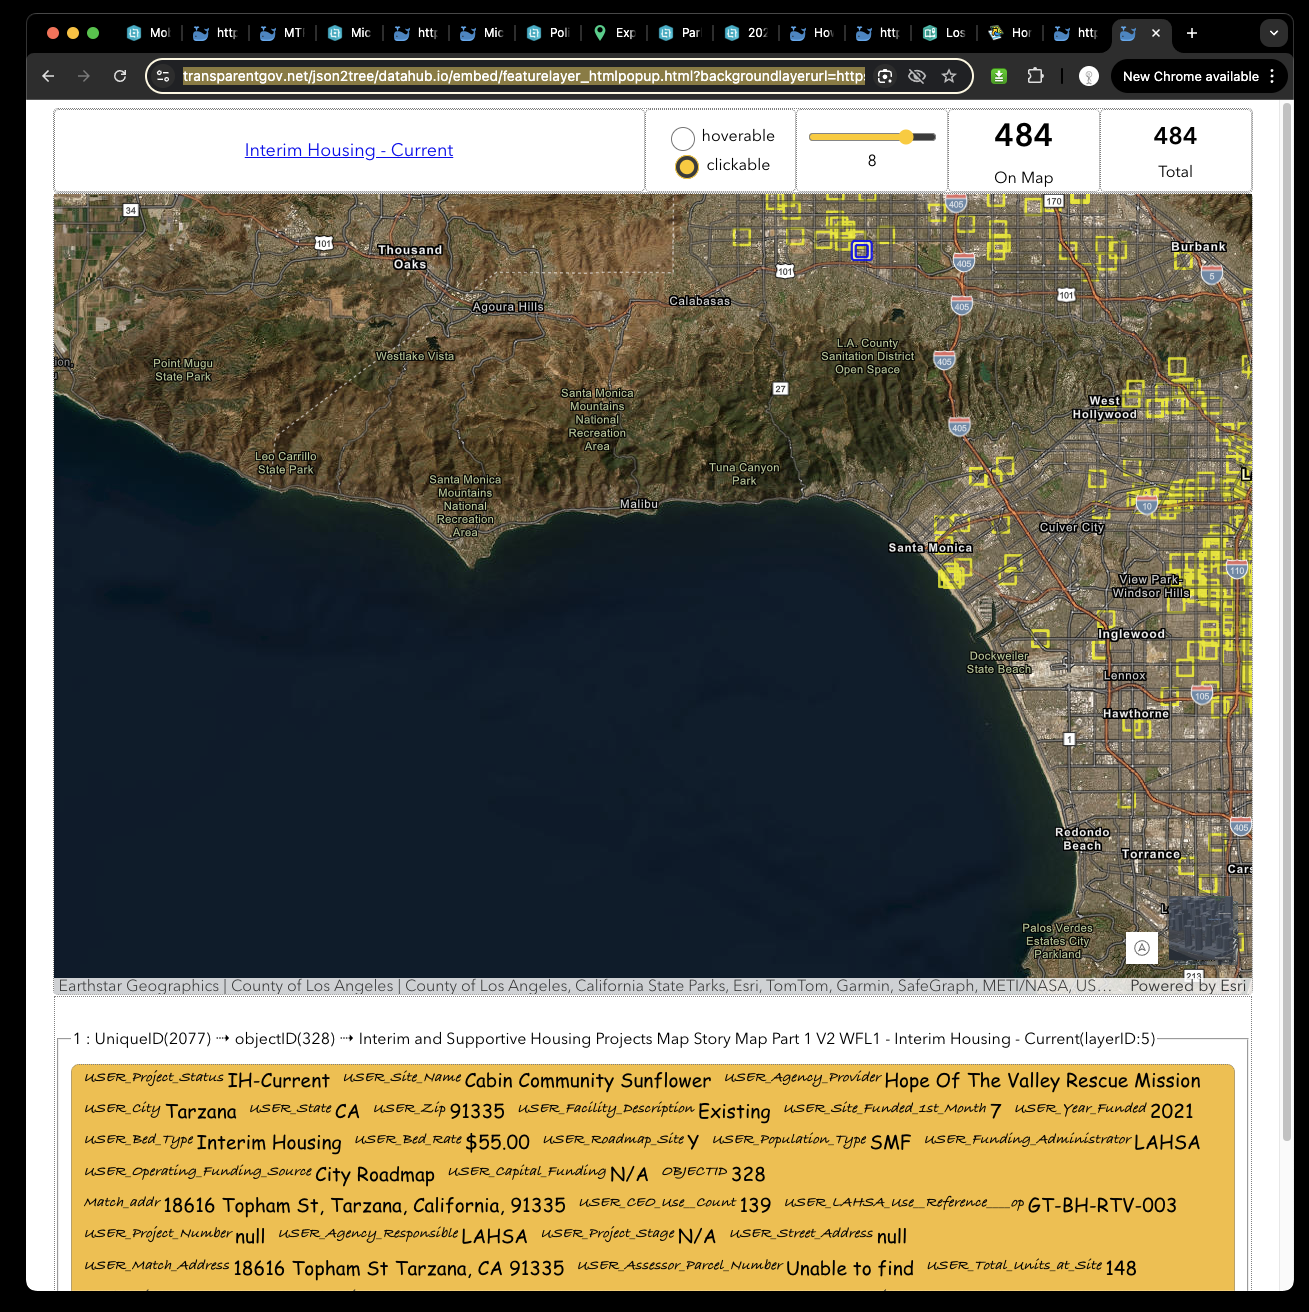
This is single layer by itself, very simple point layer, user can absorb the most of it.
https://transparentgov.net/json2tree/datahub.io/embed/featurelayer_htmlpopup.html?backgroundlayerurl=https%3A%2F%2Fservices.arcgis.com%2FRmCCgQtiZLDCtblq%2Farcgis%2Frest%2Fservices%2FInterim_and_Supportive_Housing_Projects___Map__Story_Map_Part_1__V2_WFL1%2FFeatureServer%2F5&layer=Interim+Housing+-+Current&clickorhover=click
This is all layers messy map, colorfull, beautifull, not much useful, too much color, too much information, overwhelmed user.

use model 2100
https://transparentgov.net/json2tree/arcgis/js4tree/featurelayer_sublayer_multi.html?layer_id=5&layer=Interim+Housing+-+Current&url=https%3A%2F%2Fservices.arcgis.com%2FRmCCgQtiZLDCtblq%2Farcgis%2Frest%2Fservices%2FInterim_and_Supportive_Housing_Projects___Map__Story_Map_Part_1__V2_WFL1%2FFeatureServer&_center_zoom=11&_center_lat=33.939798044944794&_center_long=-118.29918286623673&selectedItemIdArray=2%2C3%2C4%2C5%2C6%2C7%2C8%2C98765
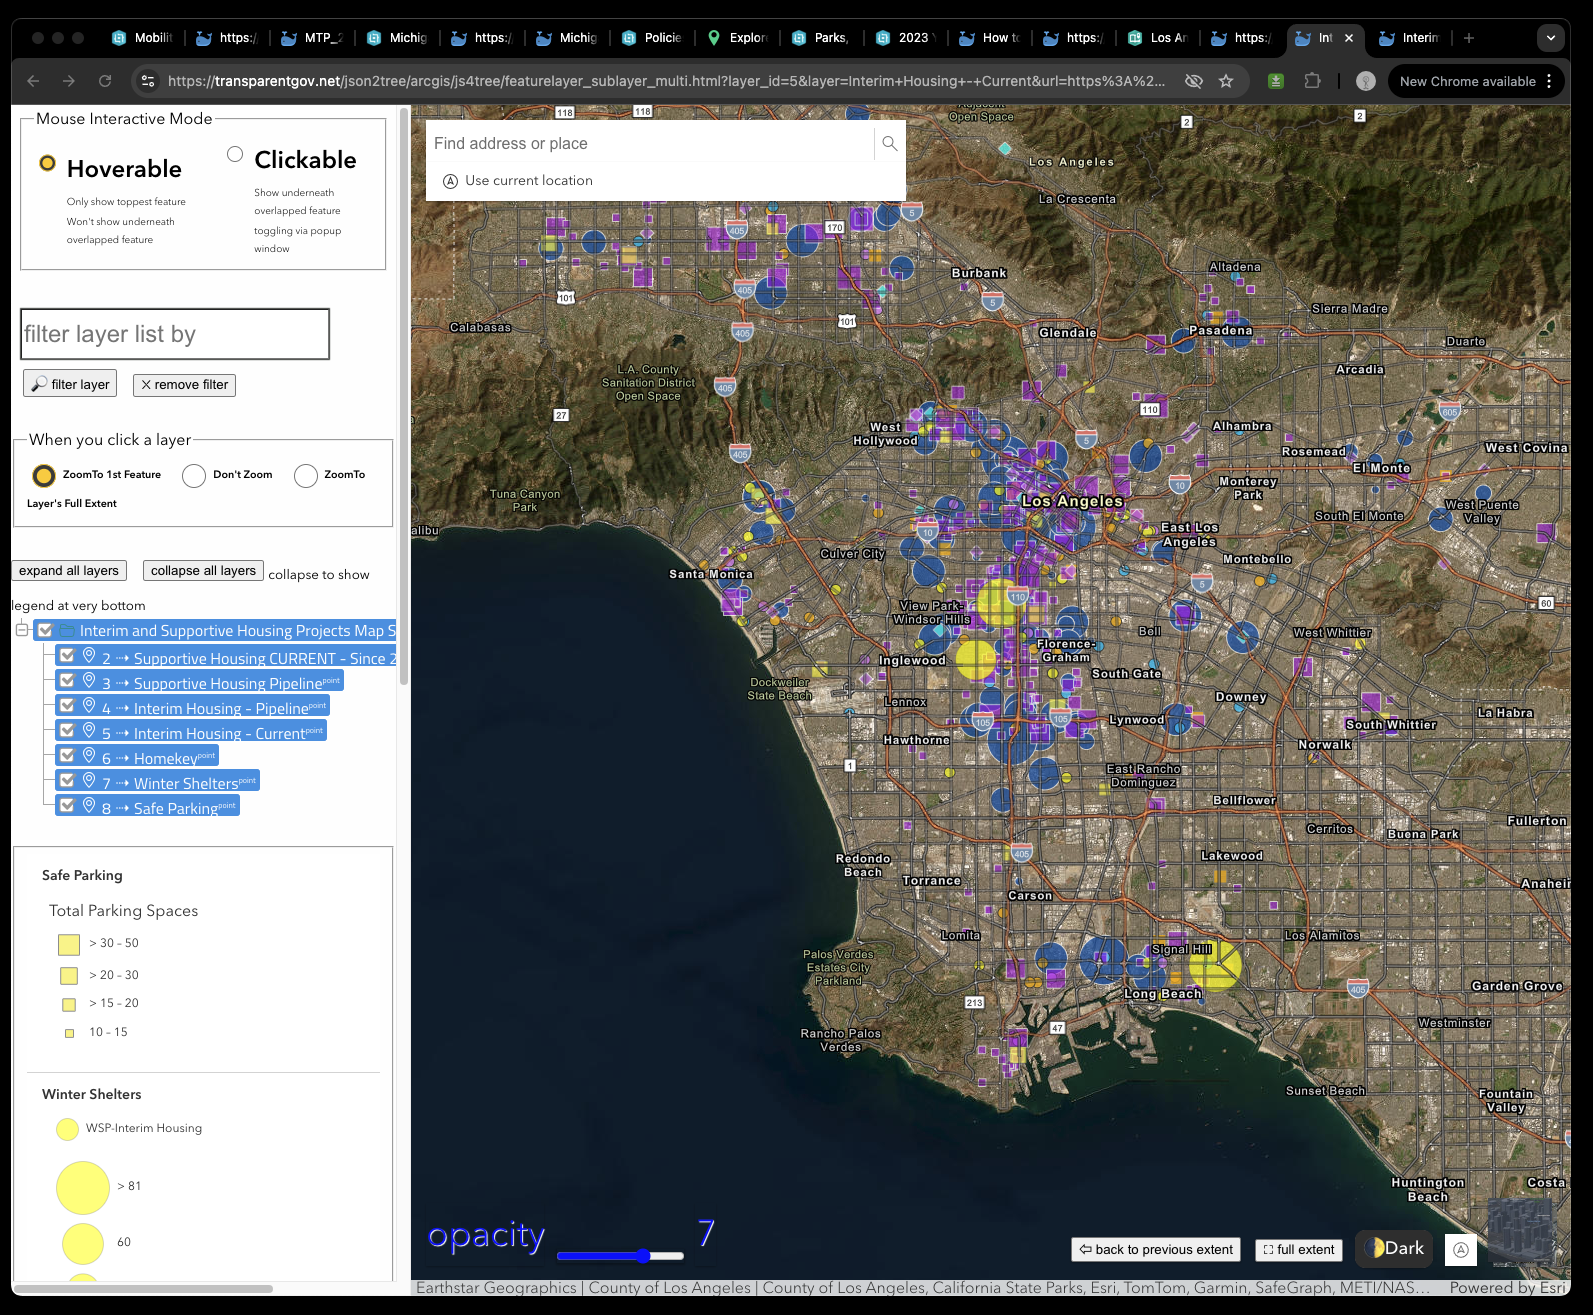
use model 2100
https://transparentgov.net/json2tree/esri/server/folder.html?org=https%3A%2F%2Fservices.arcgis.com%2FRmCCgQtiZLDCtblq%2Farcgis%2Frest%2Fservices&url=https%3A%2F%2Fservices.arcgis.com%2FRmCCgQtiZLDCtblq%2Farcgis%2Frest%2Fservices&arcgis_online_token=&timeout=9000&select_folder=1514&select_layer=5
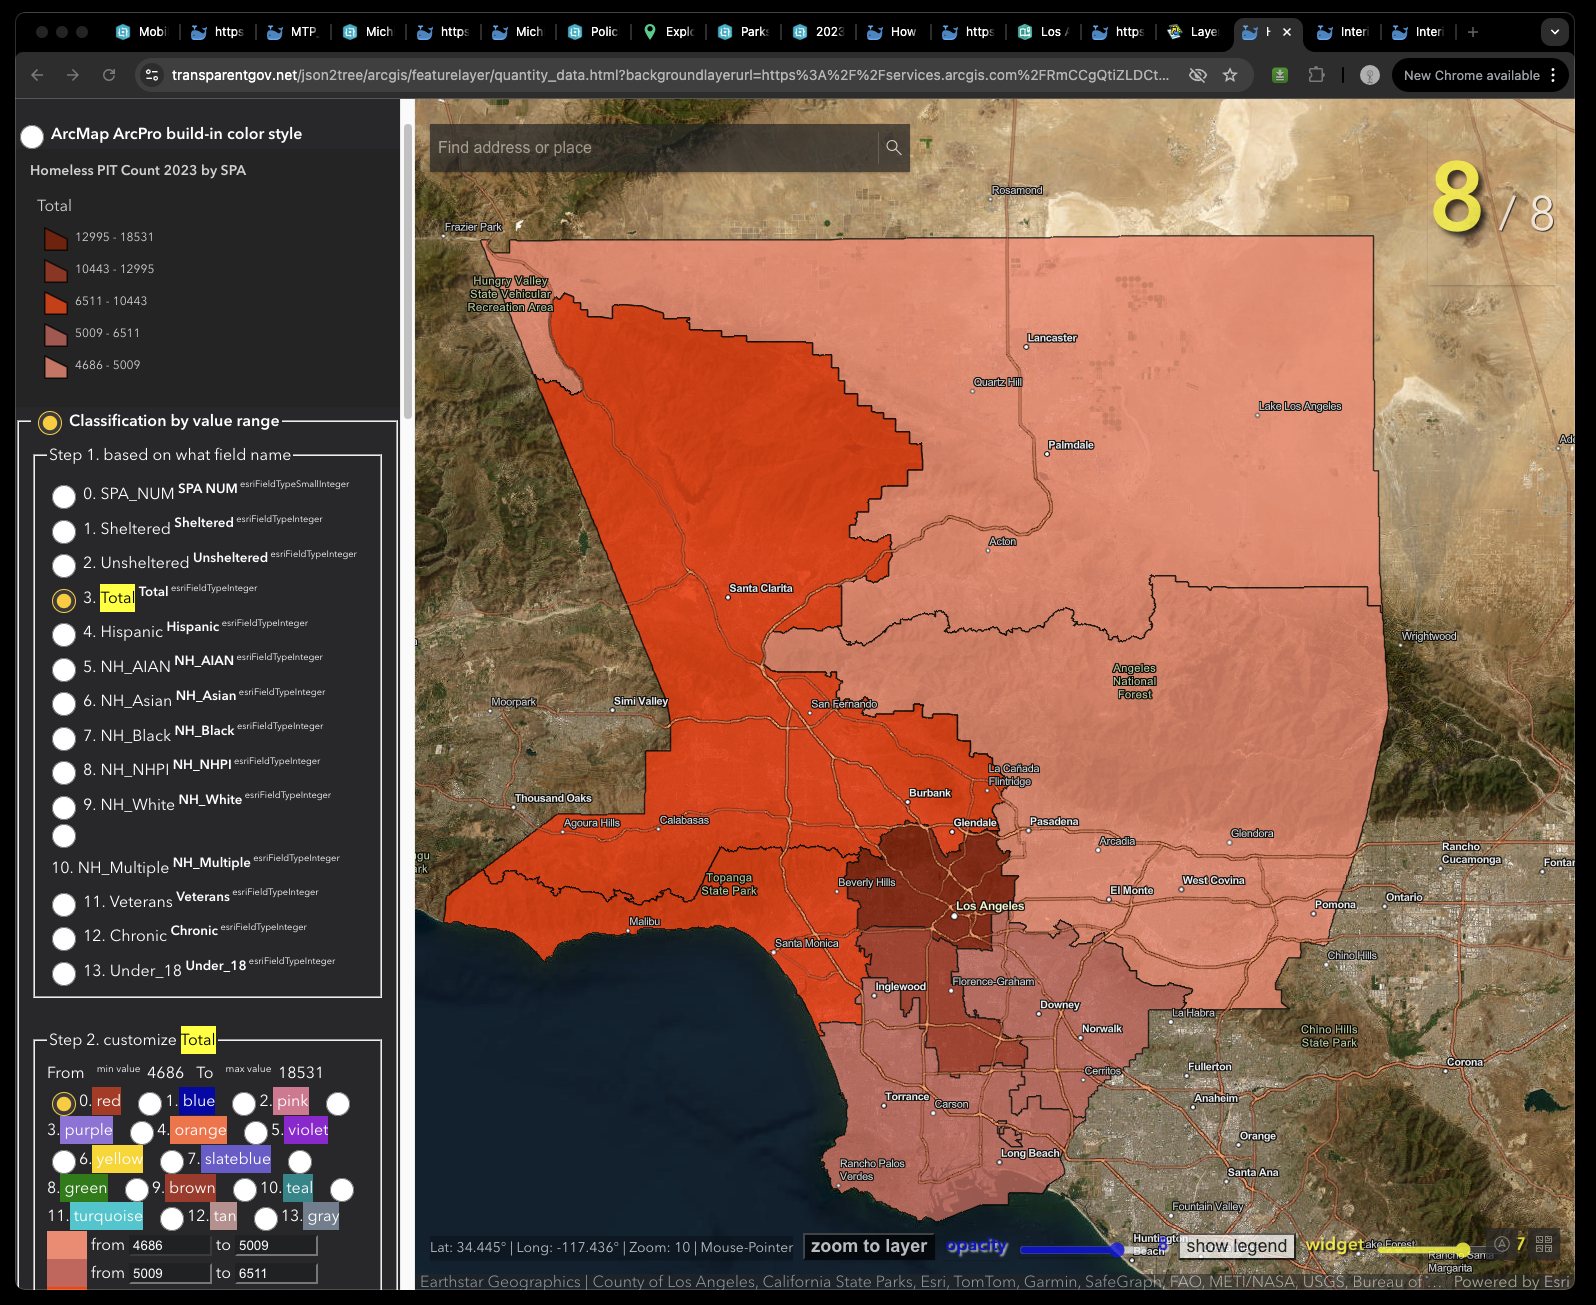
homeless total count single layer is here
https://services.arcgis.com/RmCCgQtiZLDCtblq/arcgis/rest/services/Homeless%20PIT%20Count%202023%20by%20SPA/FeatureServer/0?f=html
use model 45
https://transparentgov.net/json2tree/esri/server/folder.html?org=https%3A%2F%2Fservices.arcgis.com%2FRmCCgQtiZLDCtblq%2Farcgis%2Frest%2Fservices&url=https%3A%2F%2Fservices.arcgis.com%2FRmCCgQtiZLDCtblq%2Farcgis%2Frest%2Fservices&arcgis_online_token=&timeout=9000&select_folder=1410&select_layer=0
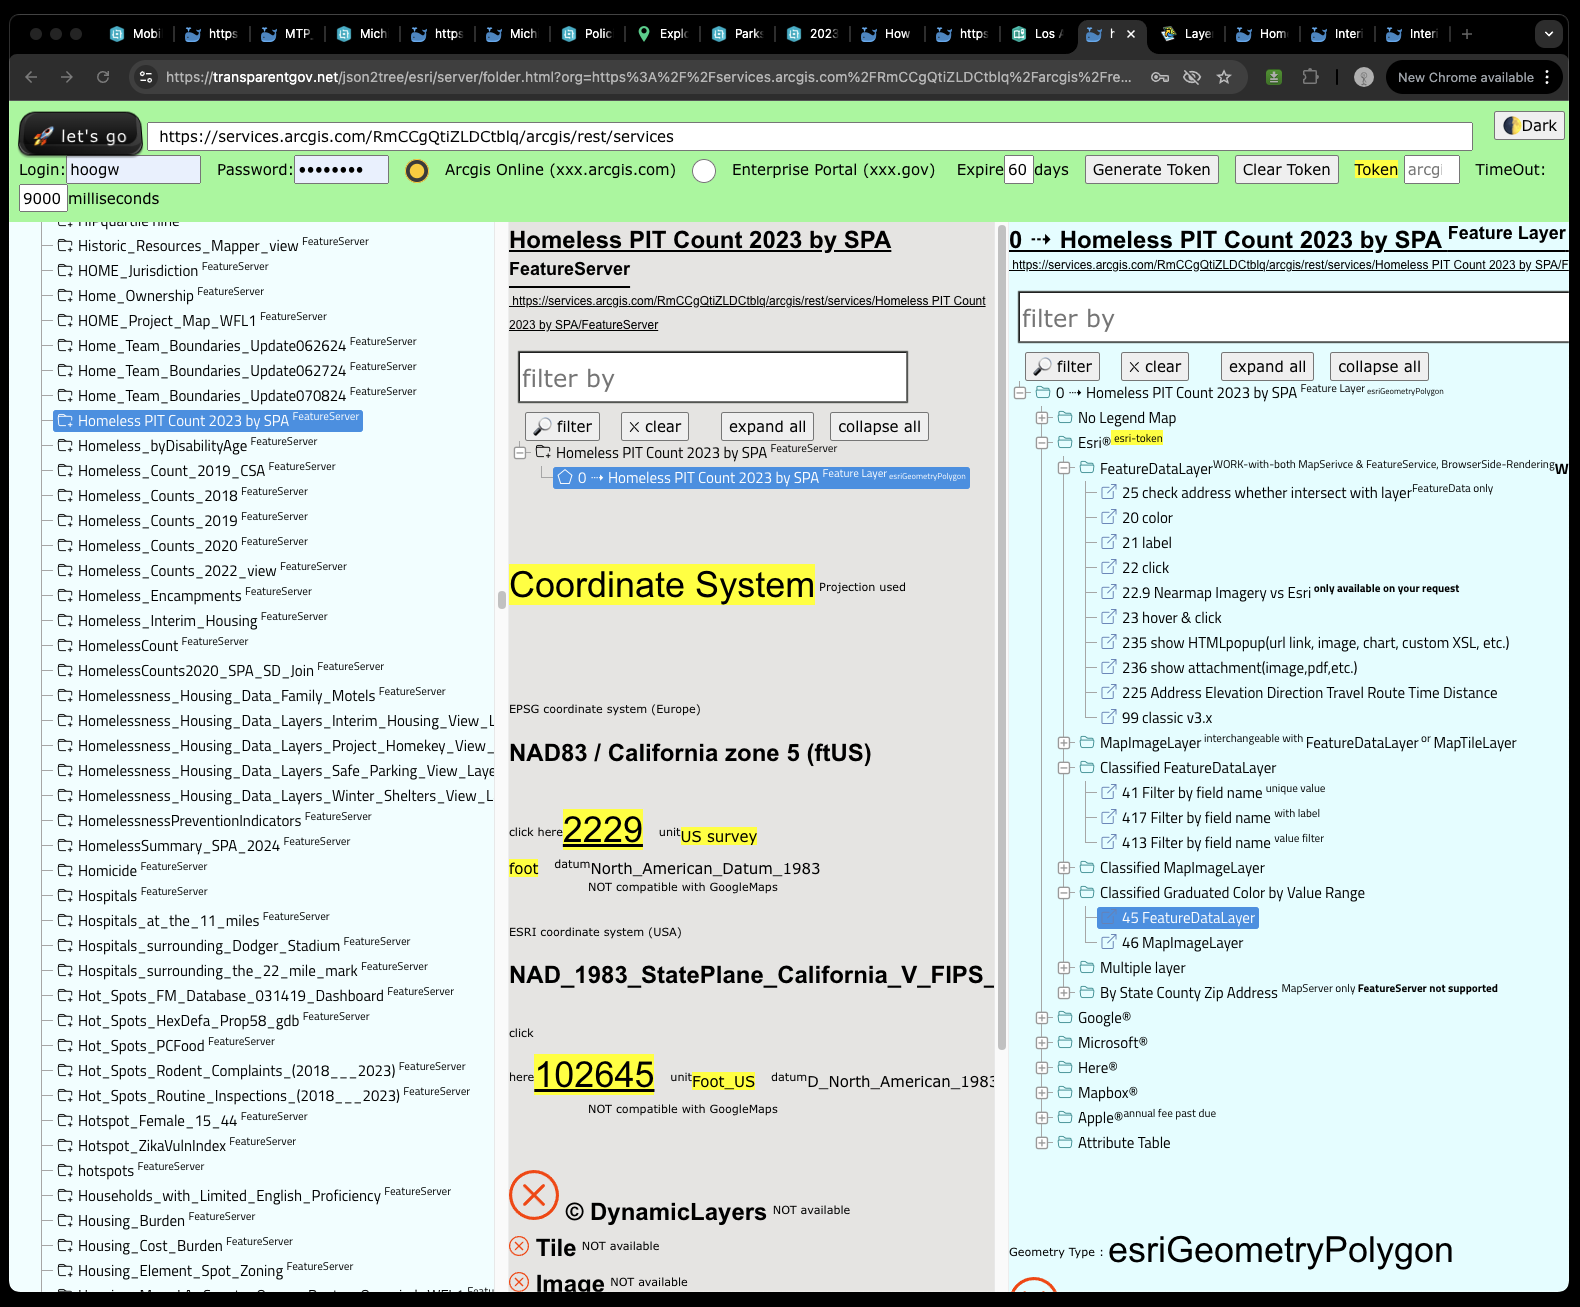
use model 45
https://transparentgov.net/json2tree/arcgis/featurelayer/quantity_data.html?backgroundlayerurl=https%3A%2F%2Fservices.arcgis.com%2FRmCCgQtiZLDCtblq%2Farcgis%2Frest%2Fservices%2FHomeless+PIT+Count+2023+by+SPA%2FFeatureServer%2F0&layer=Homeless+PIT+Count+2023+by+SPA&dynamicLabelField=nolabel&colorScale=colorScale_red&symbolType=quantity&_center_lat=34.30409910773743&_center_long=-118.1875102268061&_center_zoom=10&panto=0&quantityFieldName=Total
say bye to web app builder in Q1 2026, eneterprise 12.0
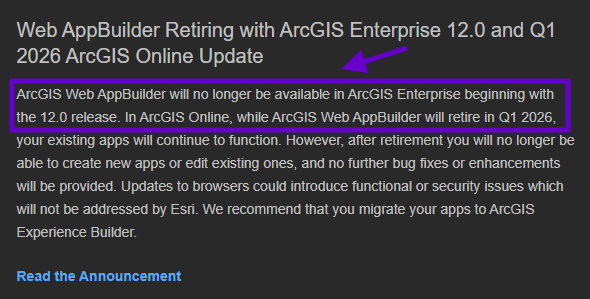
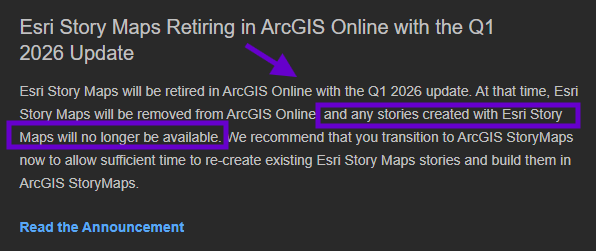
say bye to story map in Q1 2026, eneterprise 12.0
