QGIS software download + installation required
basic gis knowledge required, $$$ not need
Method 4 is the best for most people
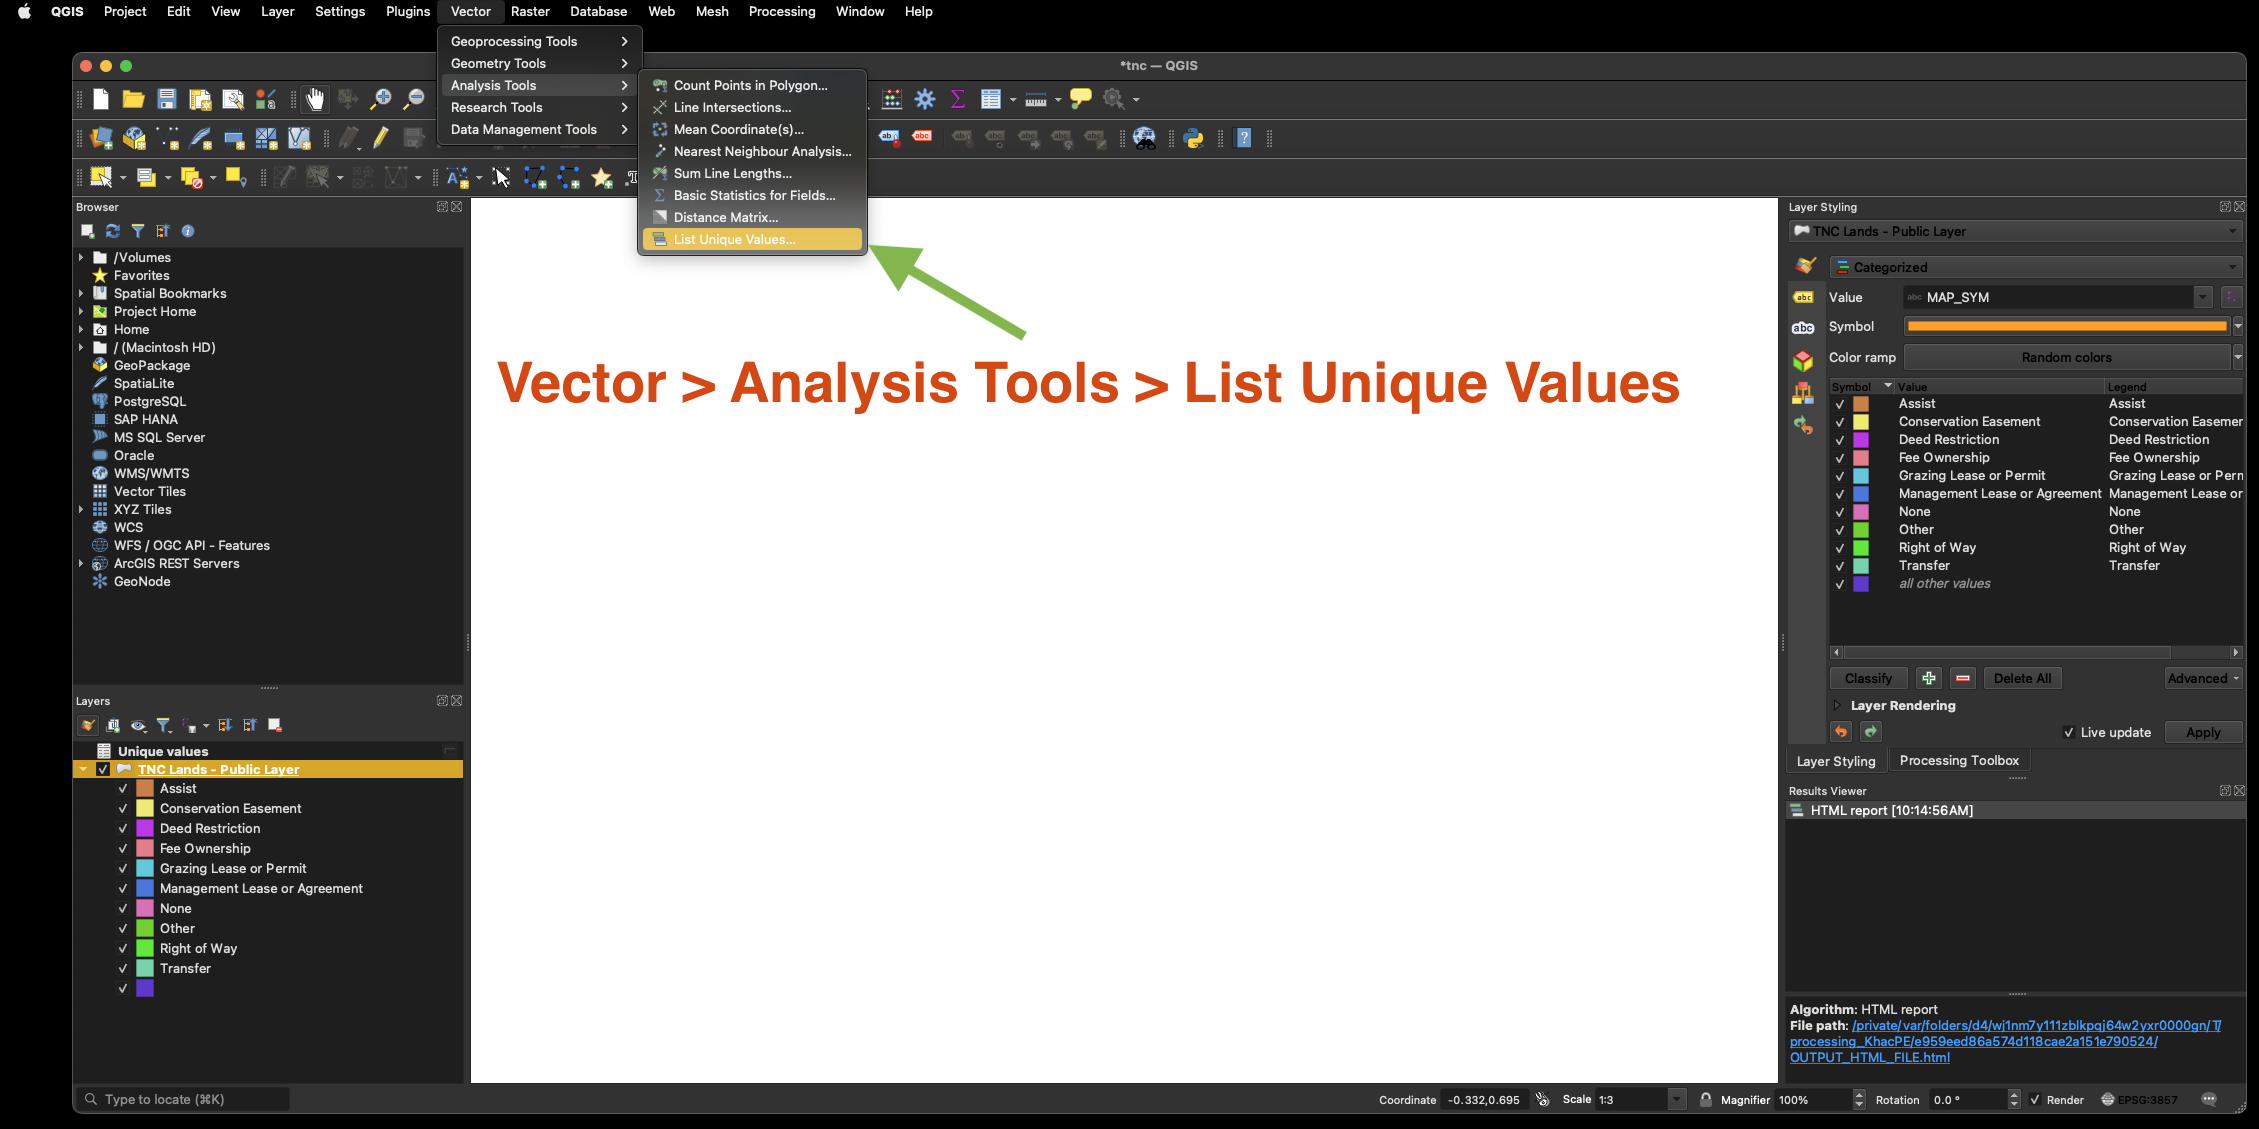
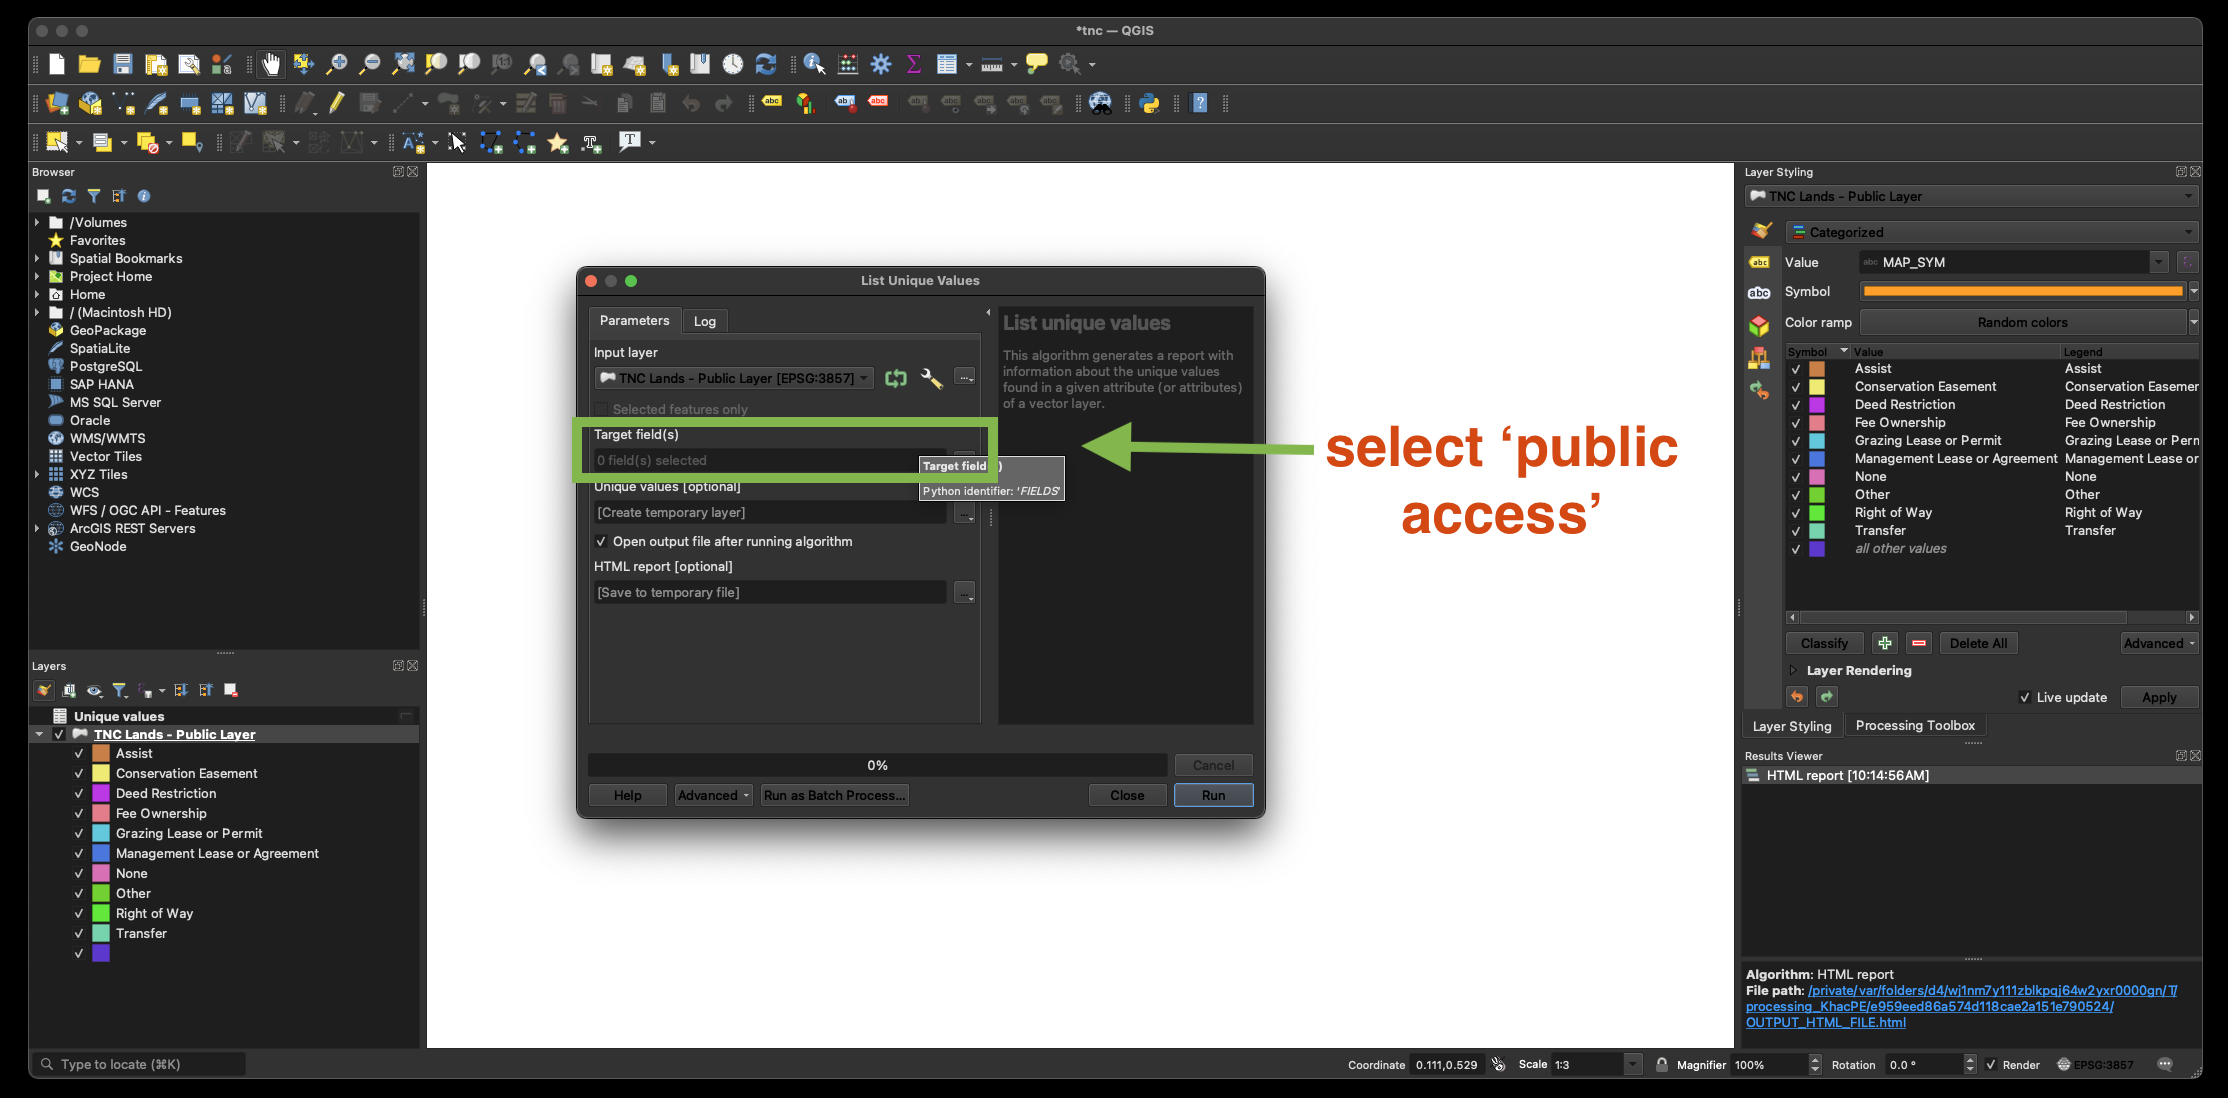
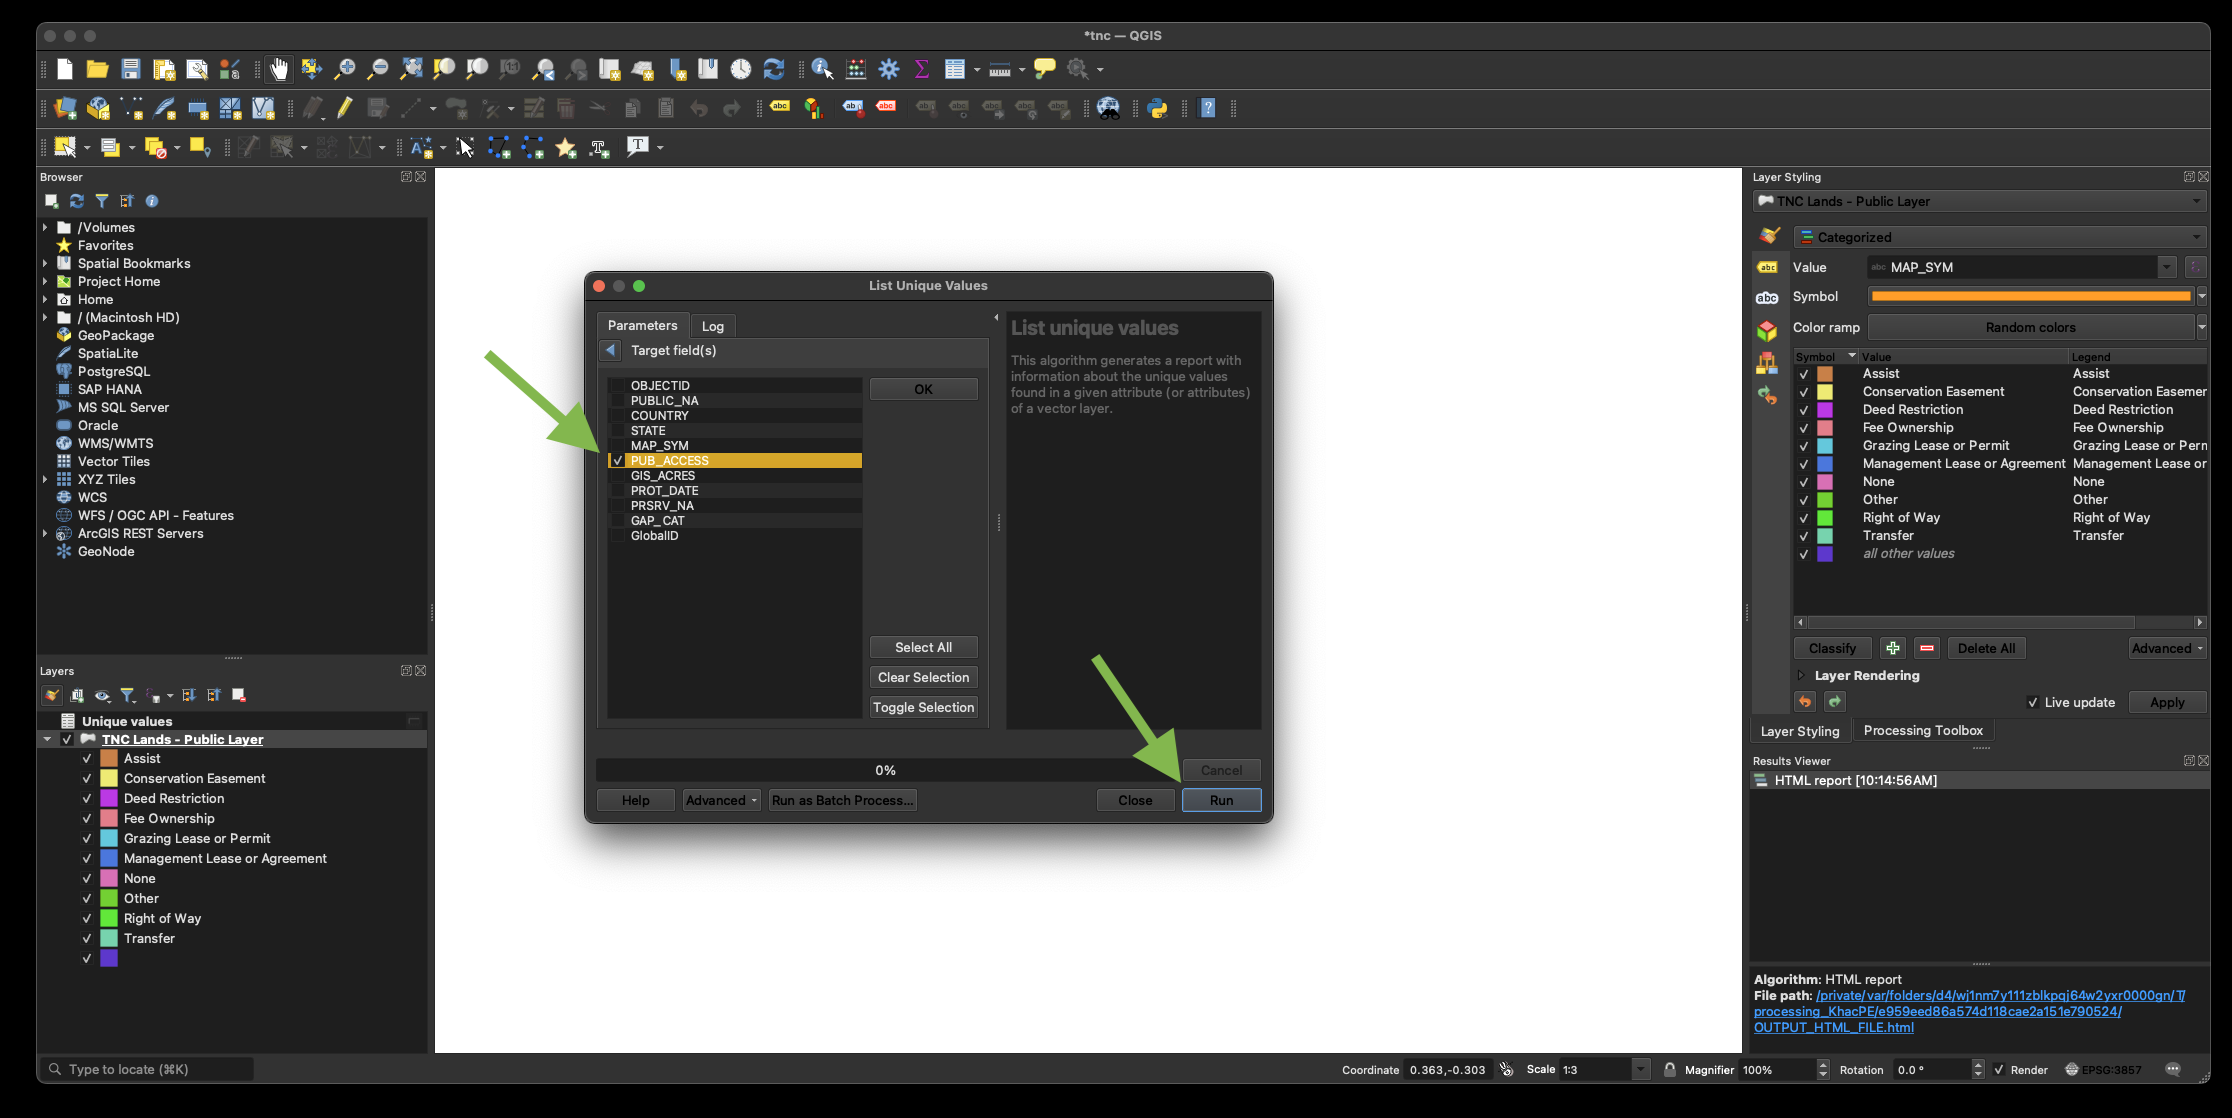
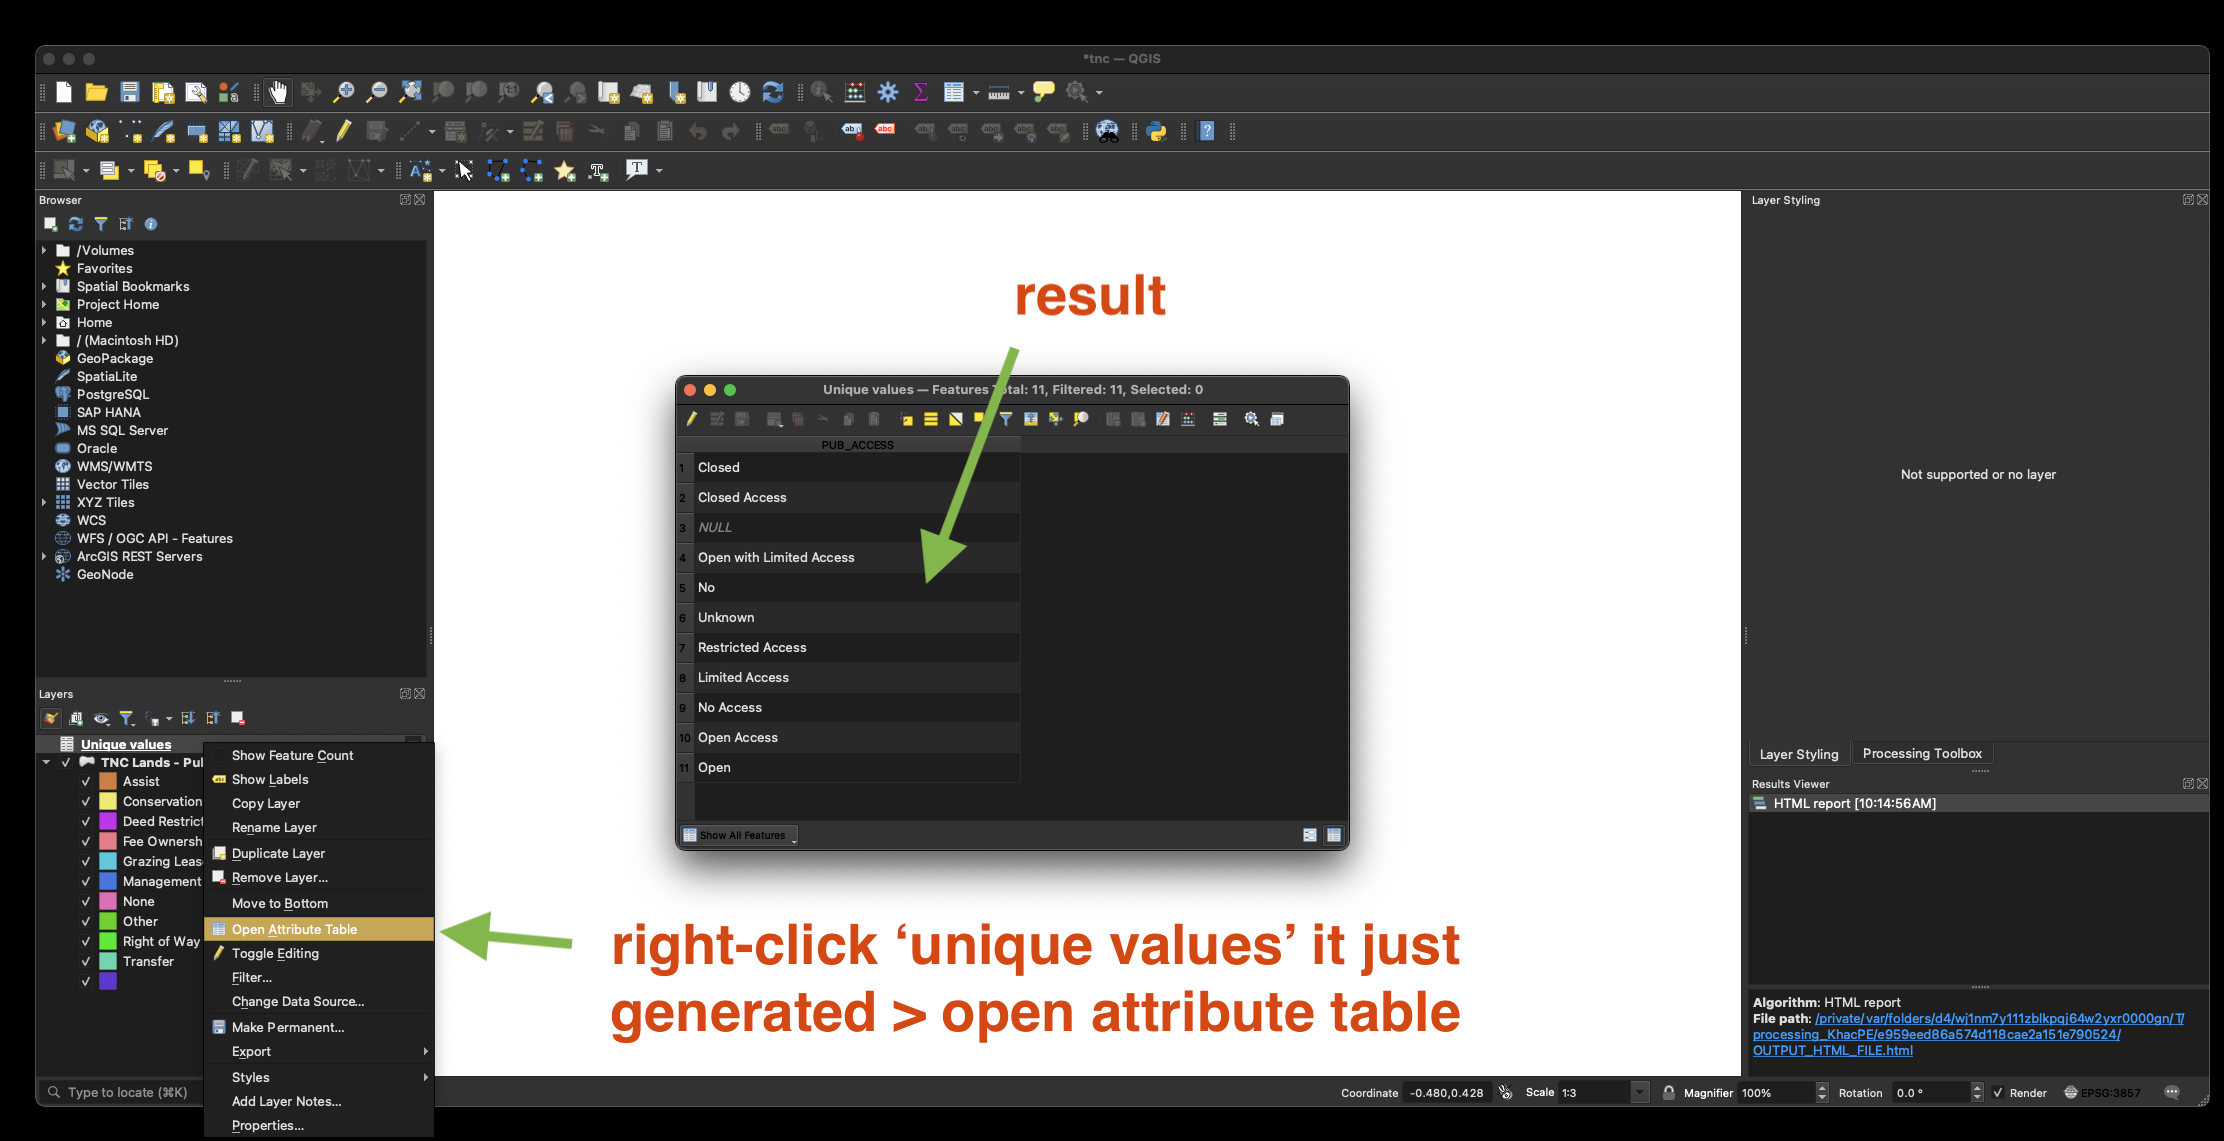
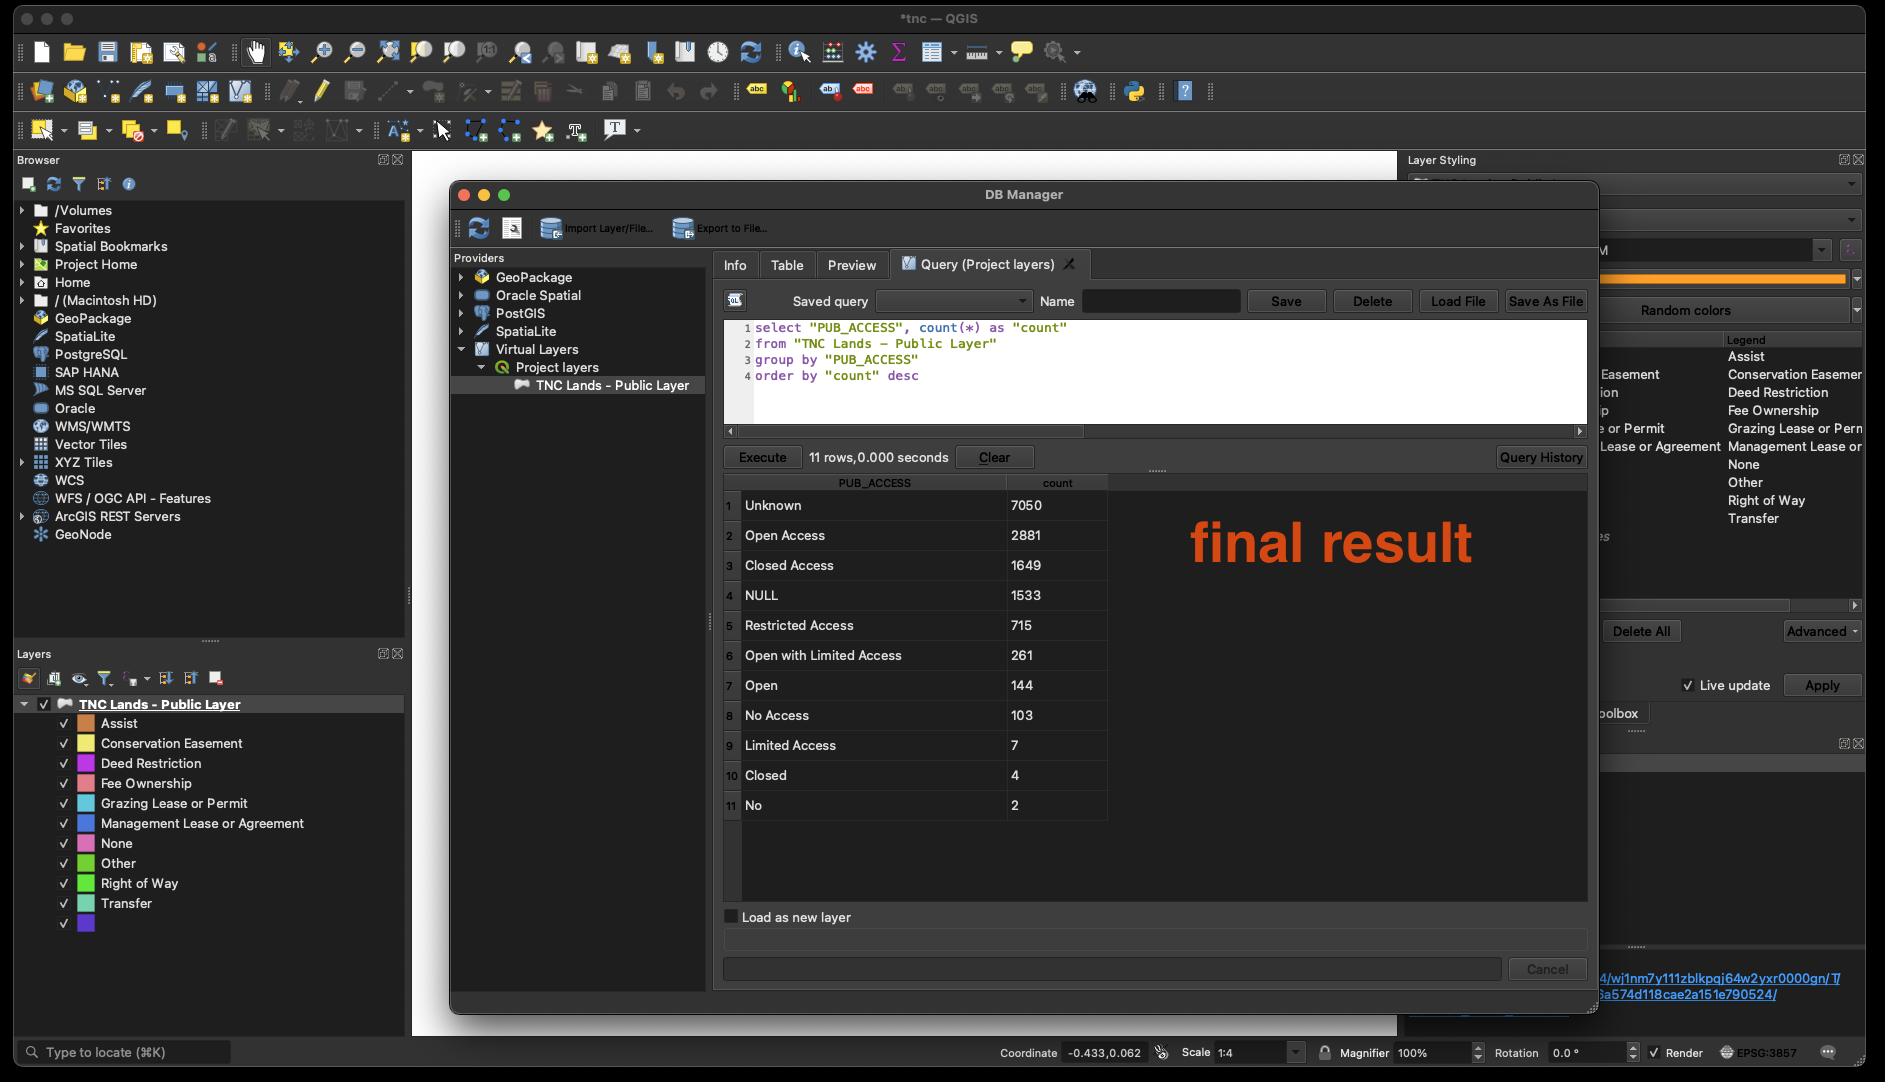
1) List unqiue value
![](https://transparentgov.net/data/img3/unique_1.png)
![](https://transparentgov.net/data/img3/unique_2.png)
![](https://transparentgov.net/data/img3/unique_3.png)
![](https://transparentgov.net/data/img3/unique_4.png)
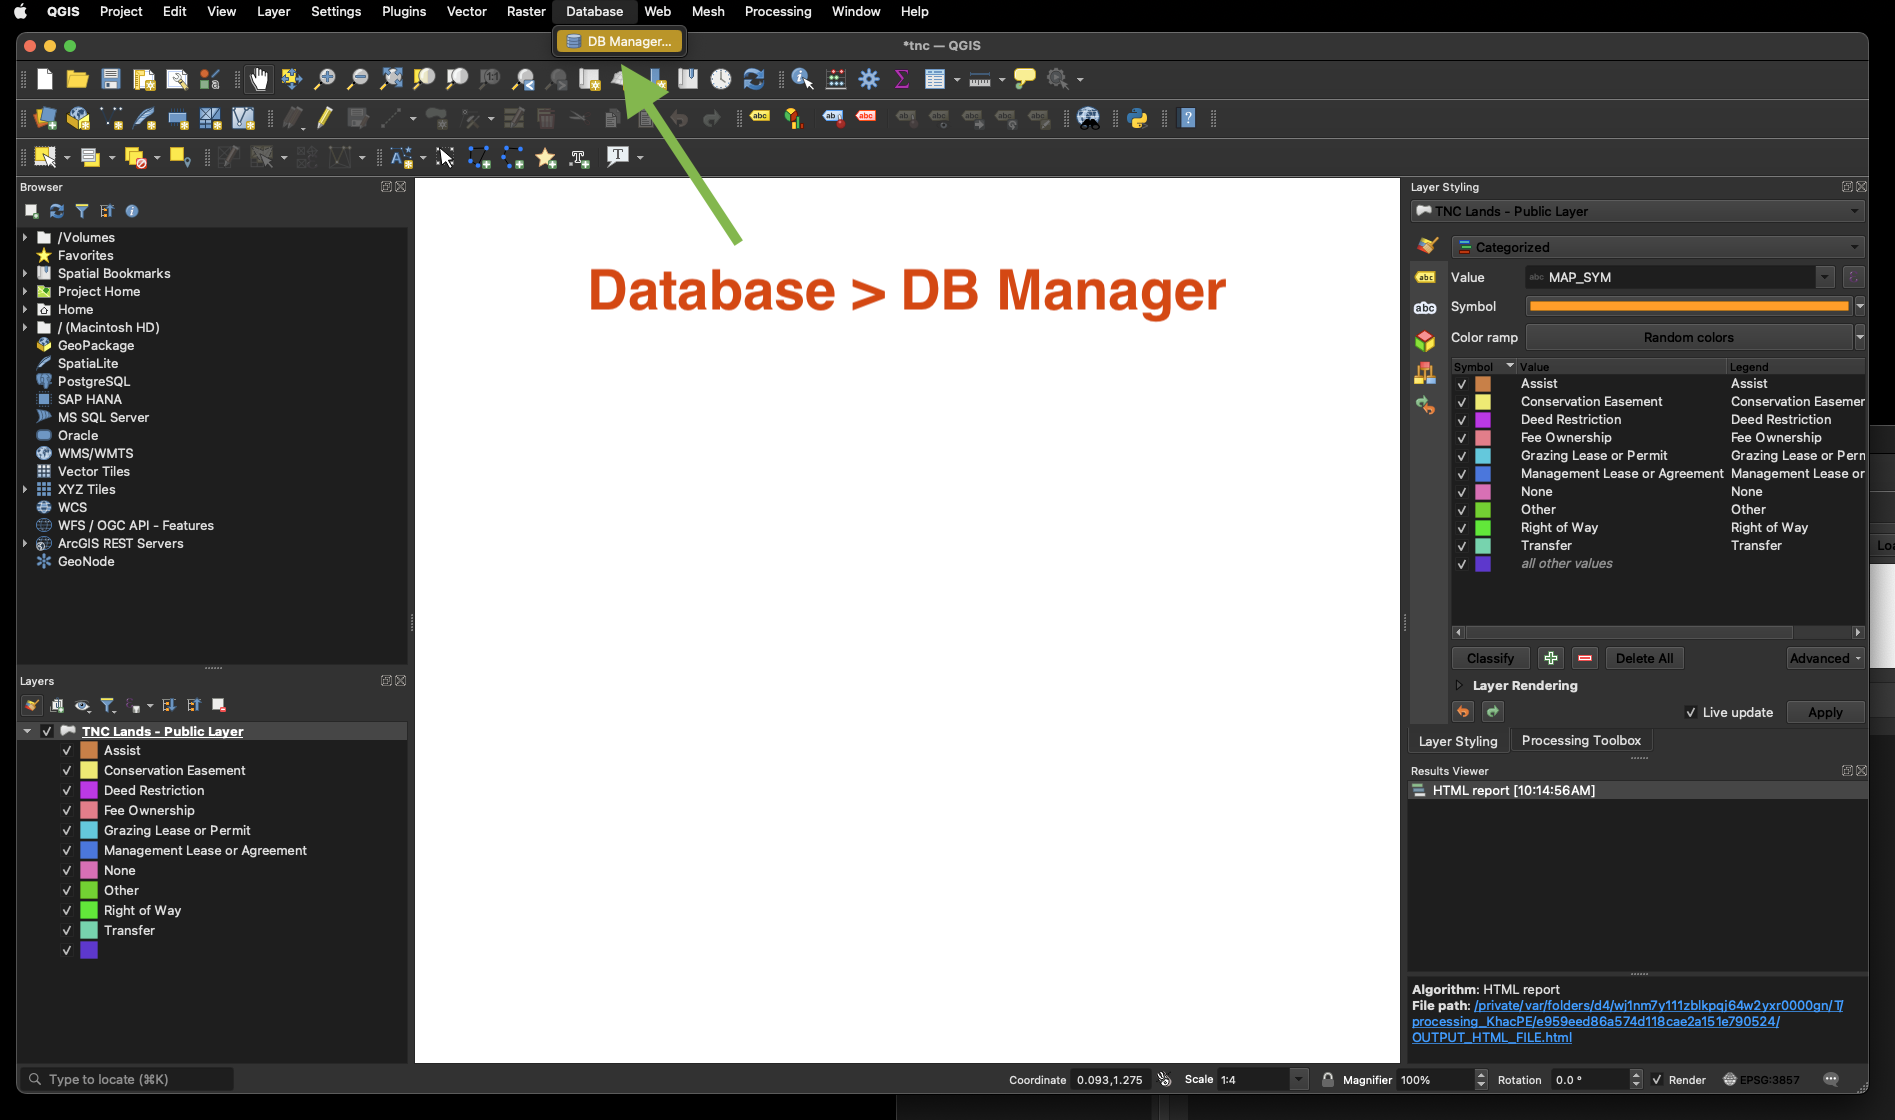
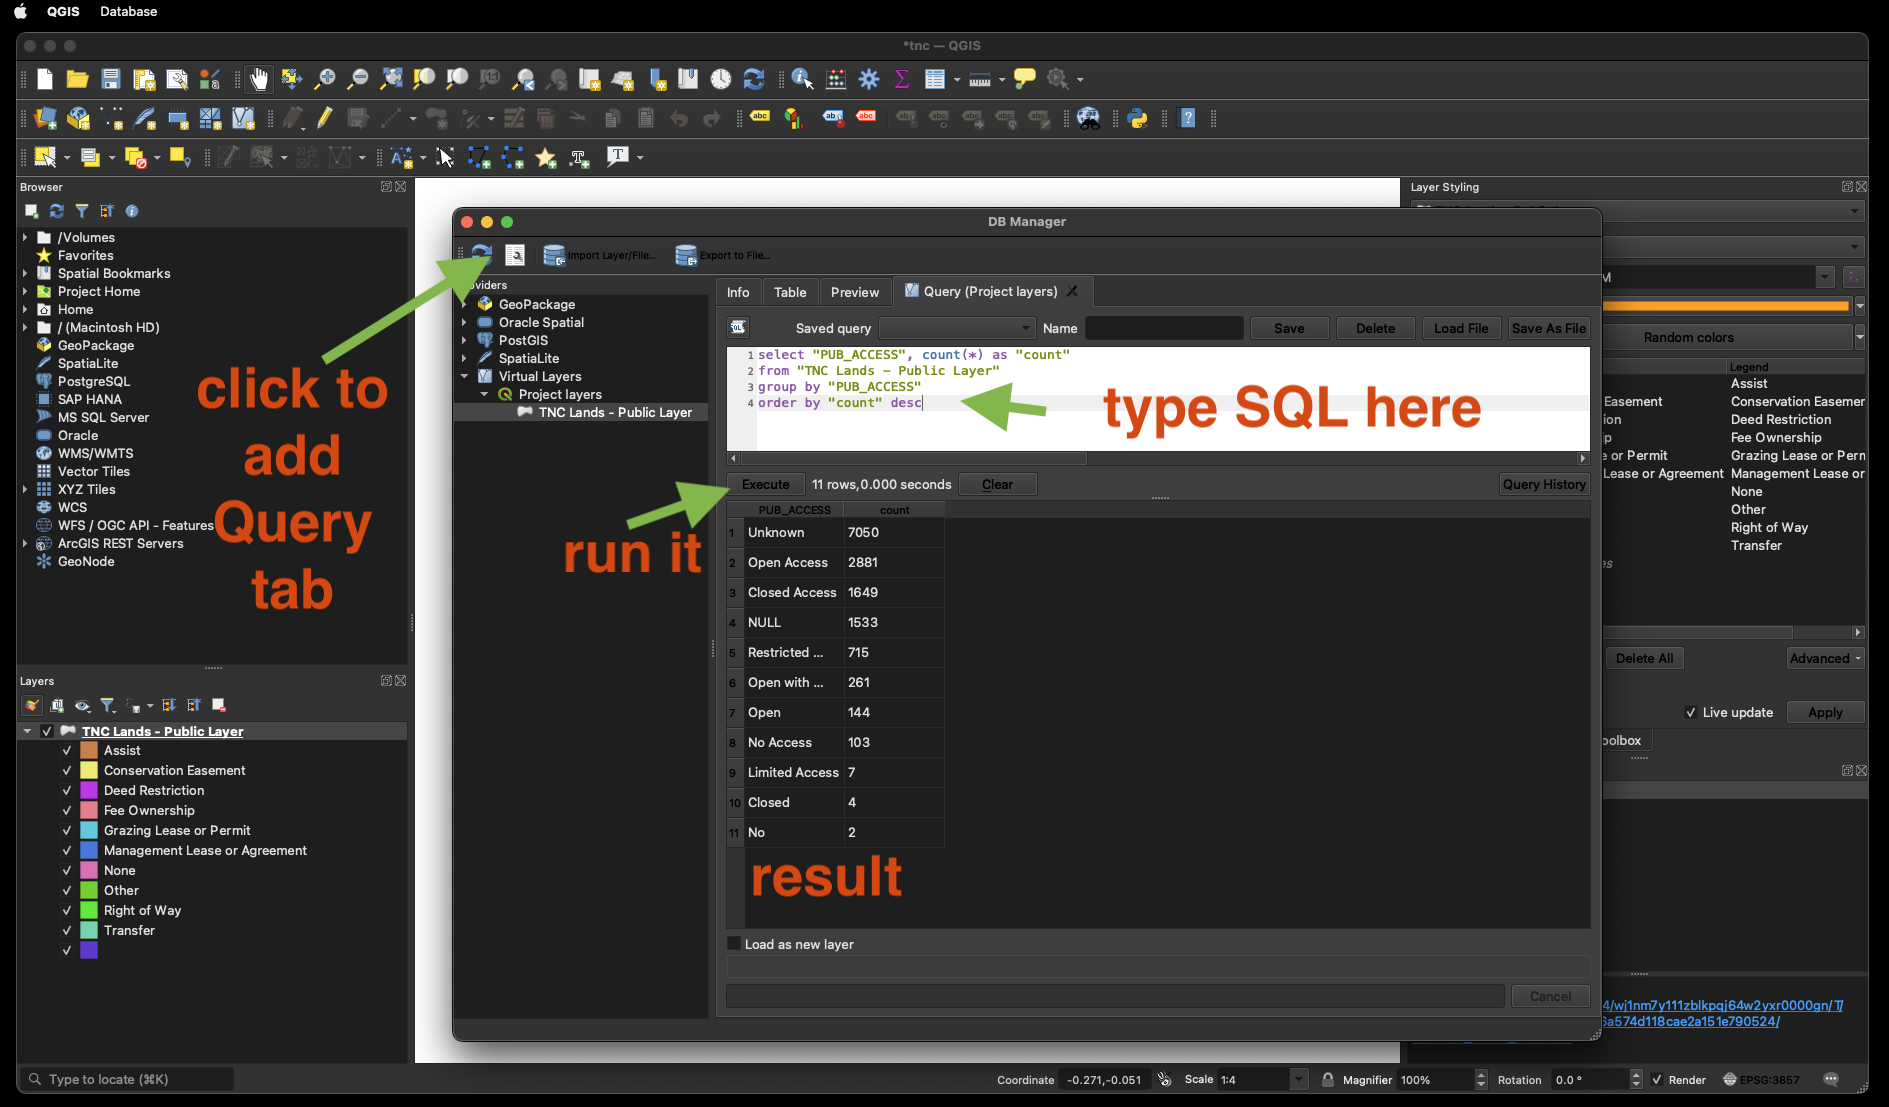
2) Use SQL and virtual layer
![](https://transparentgov.net/data/img3/unique_5.png)
![](https://transparentgov.net/data/img3/unique_6.png)
![](https://transparentgov.net/data/img3/unique_7.png)
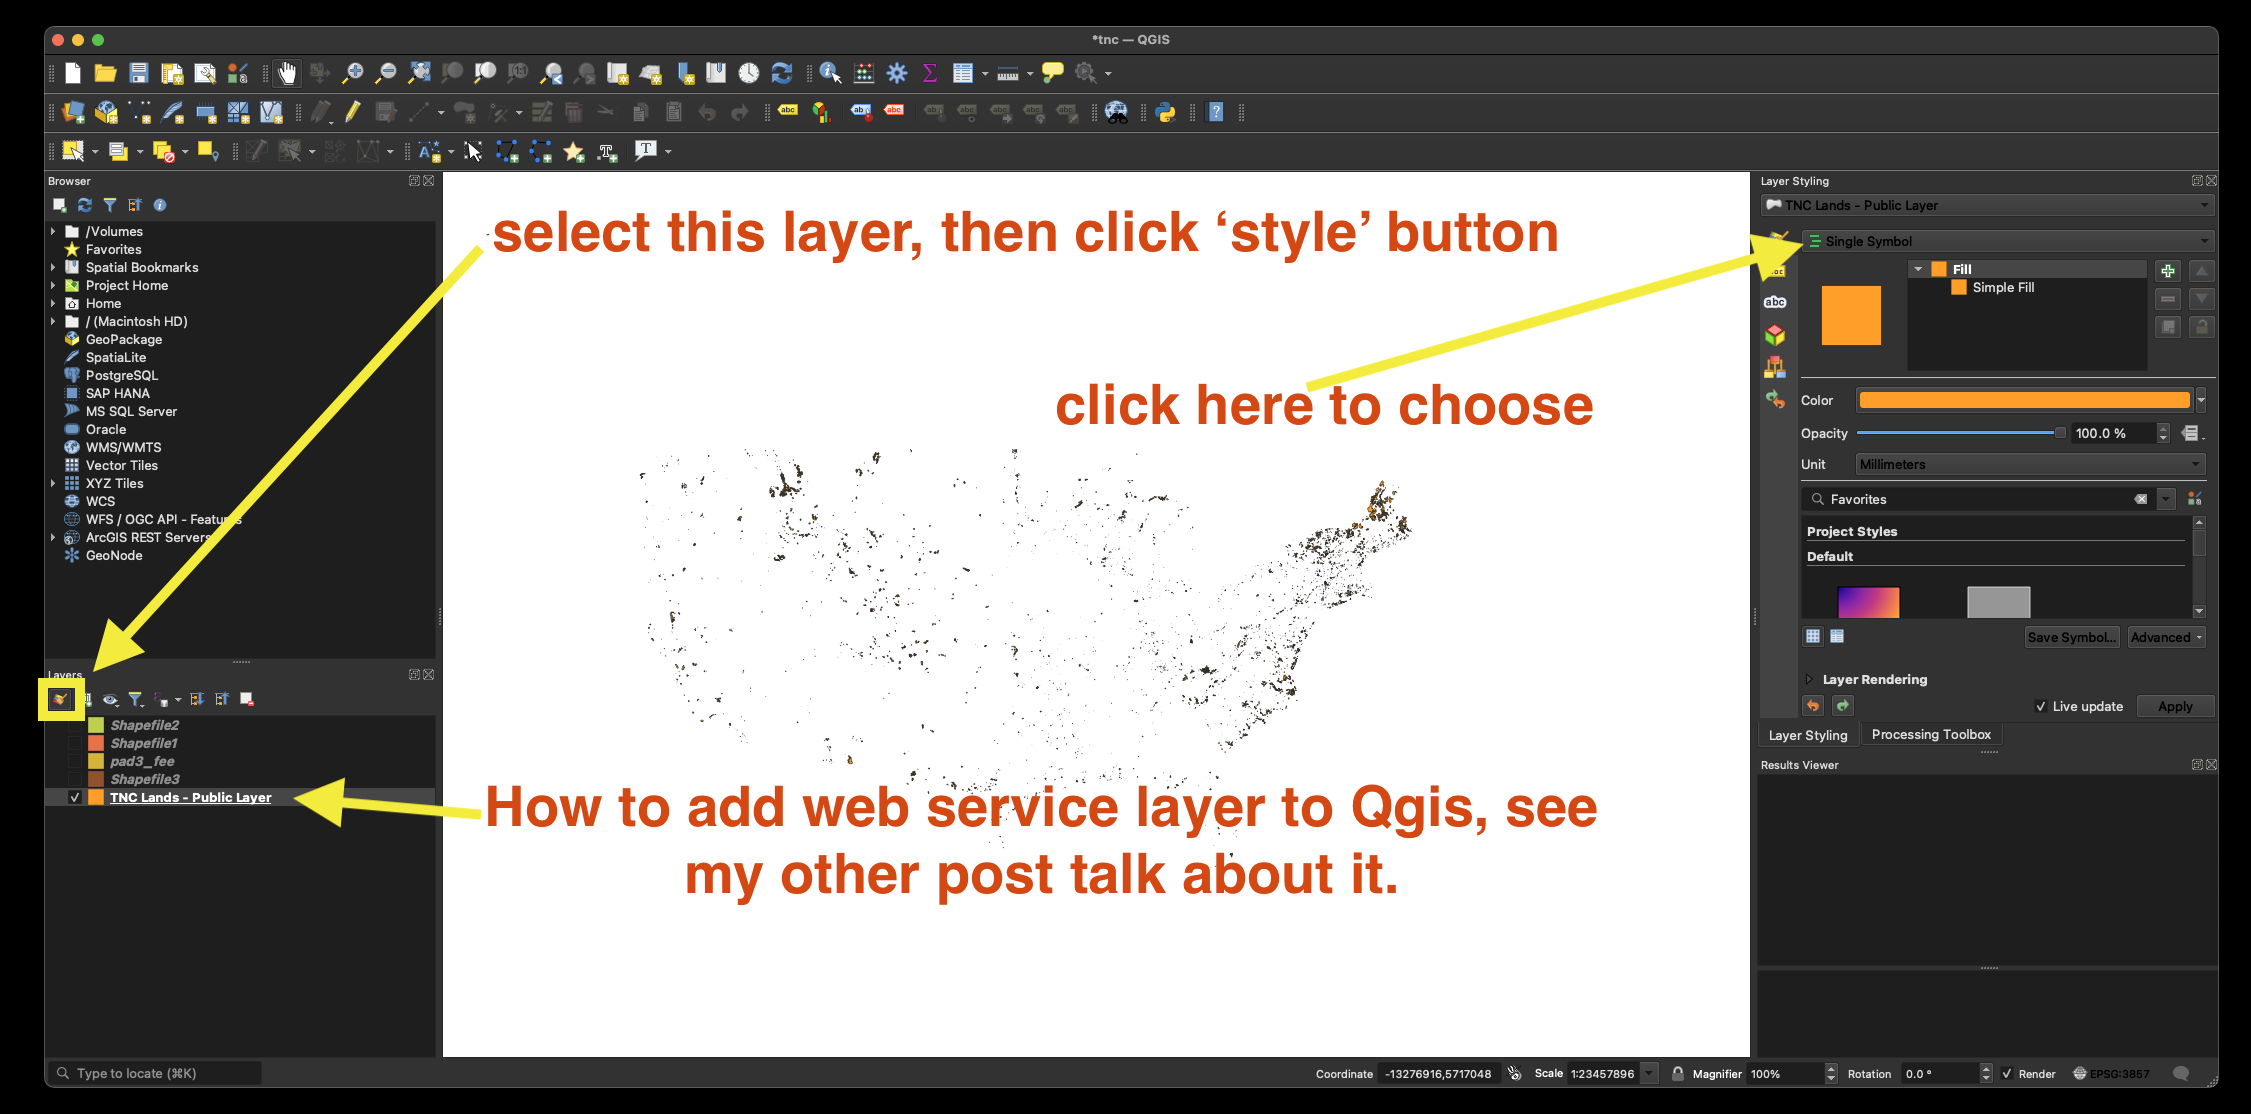
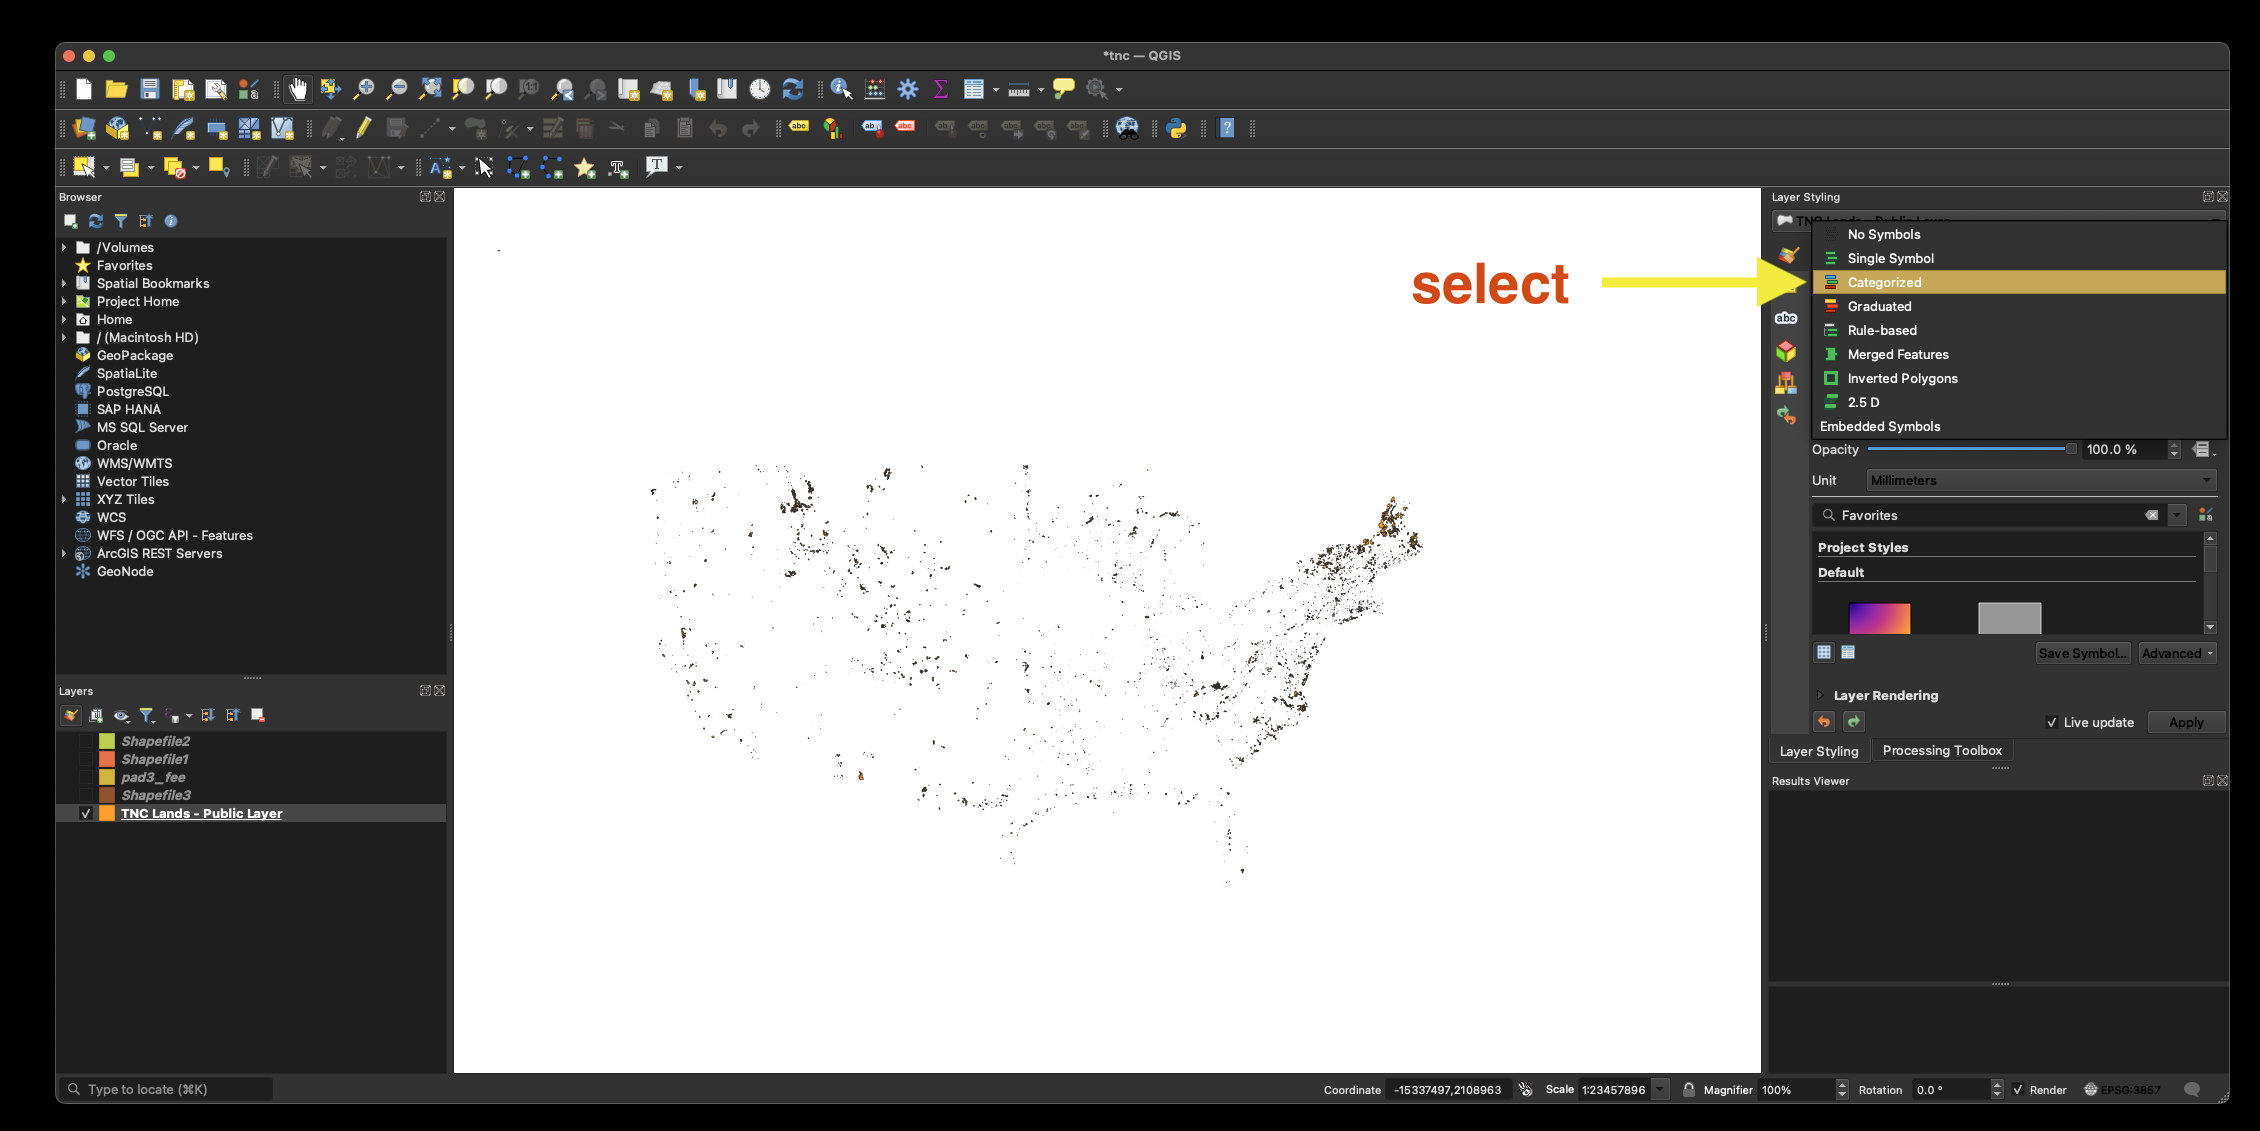
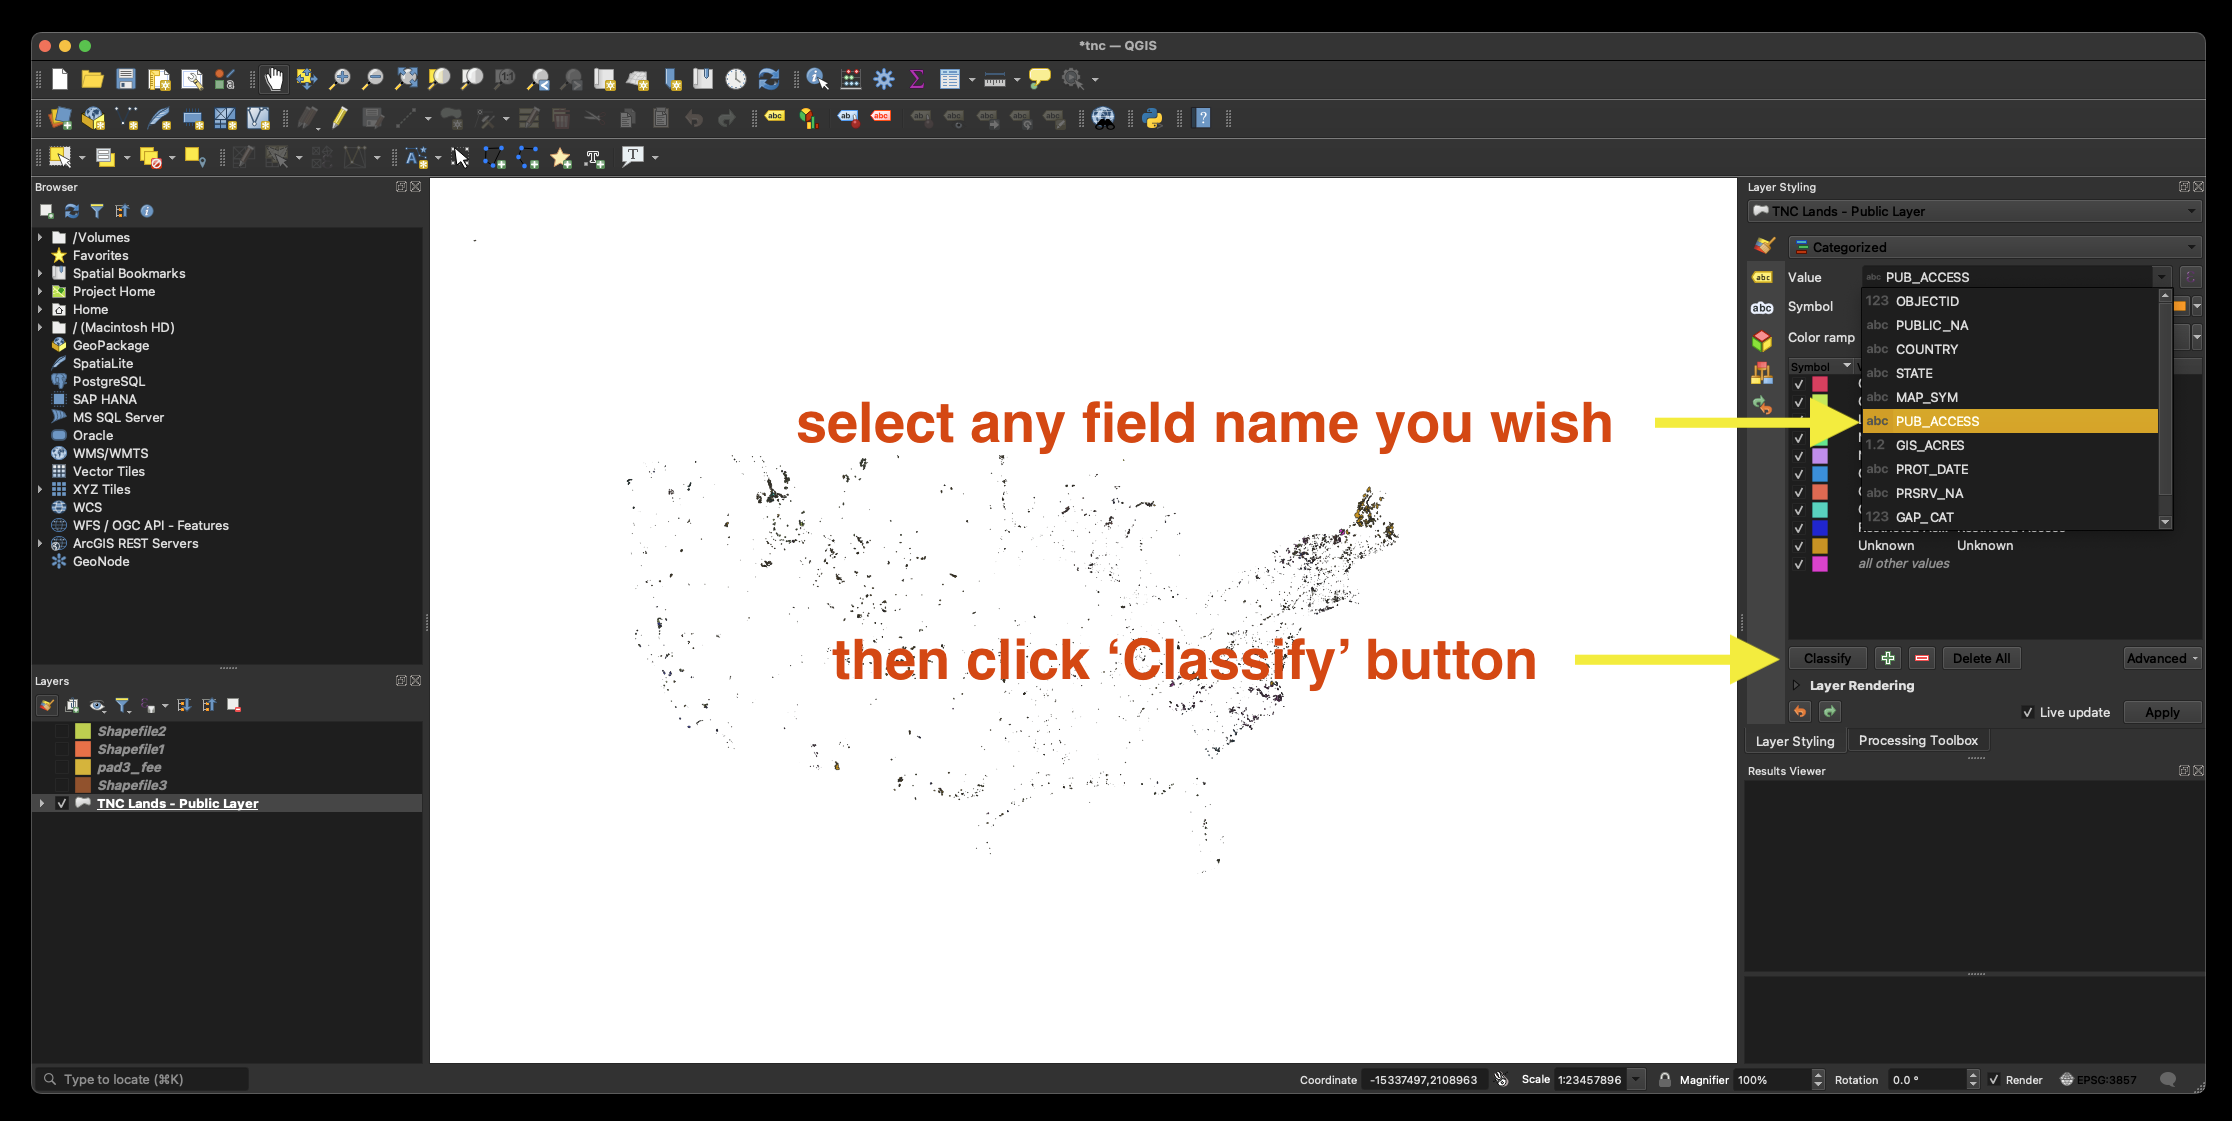
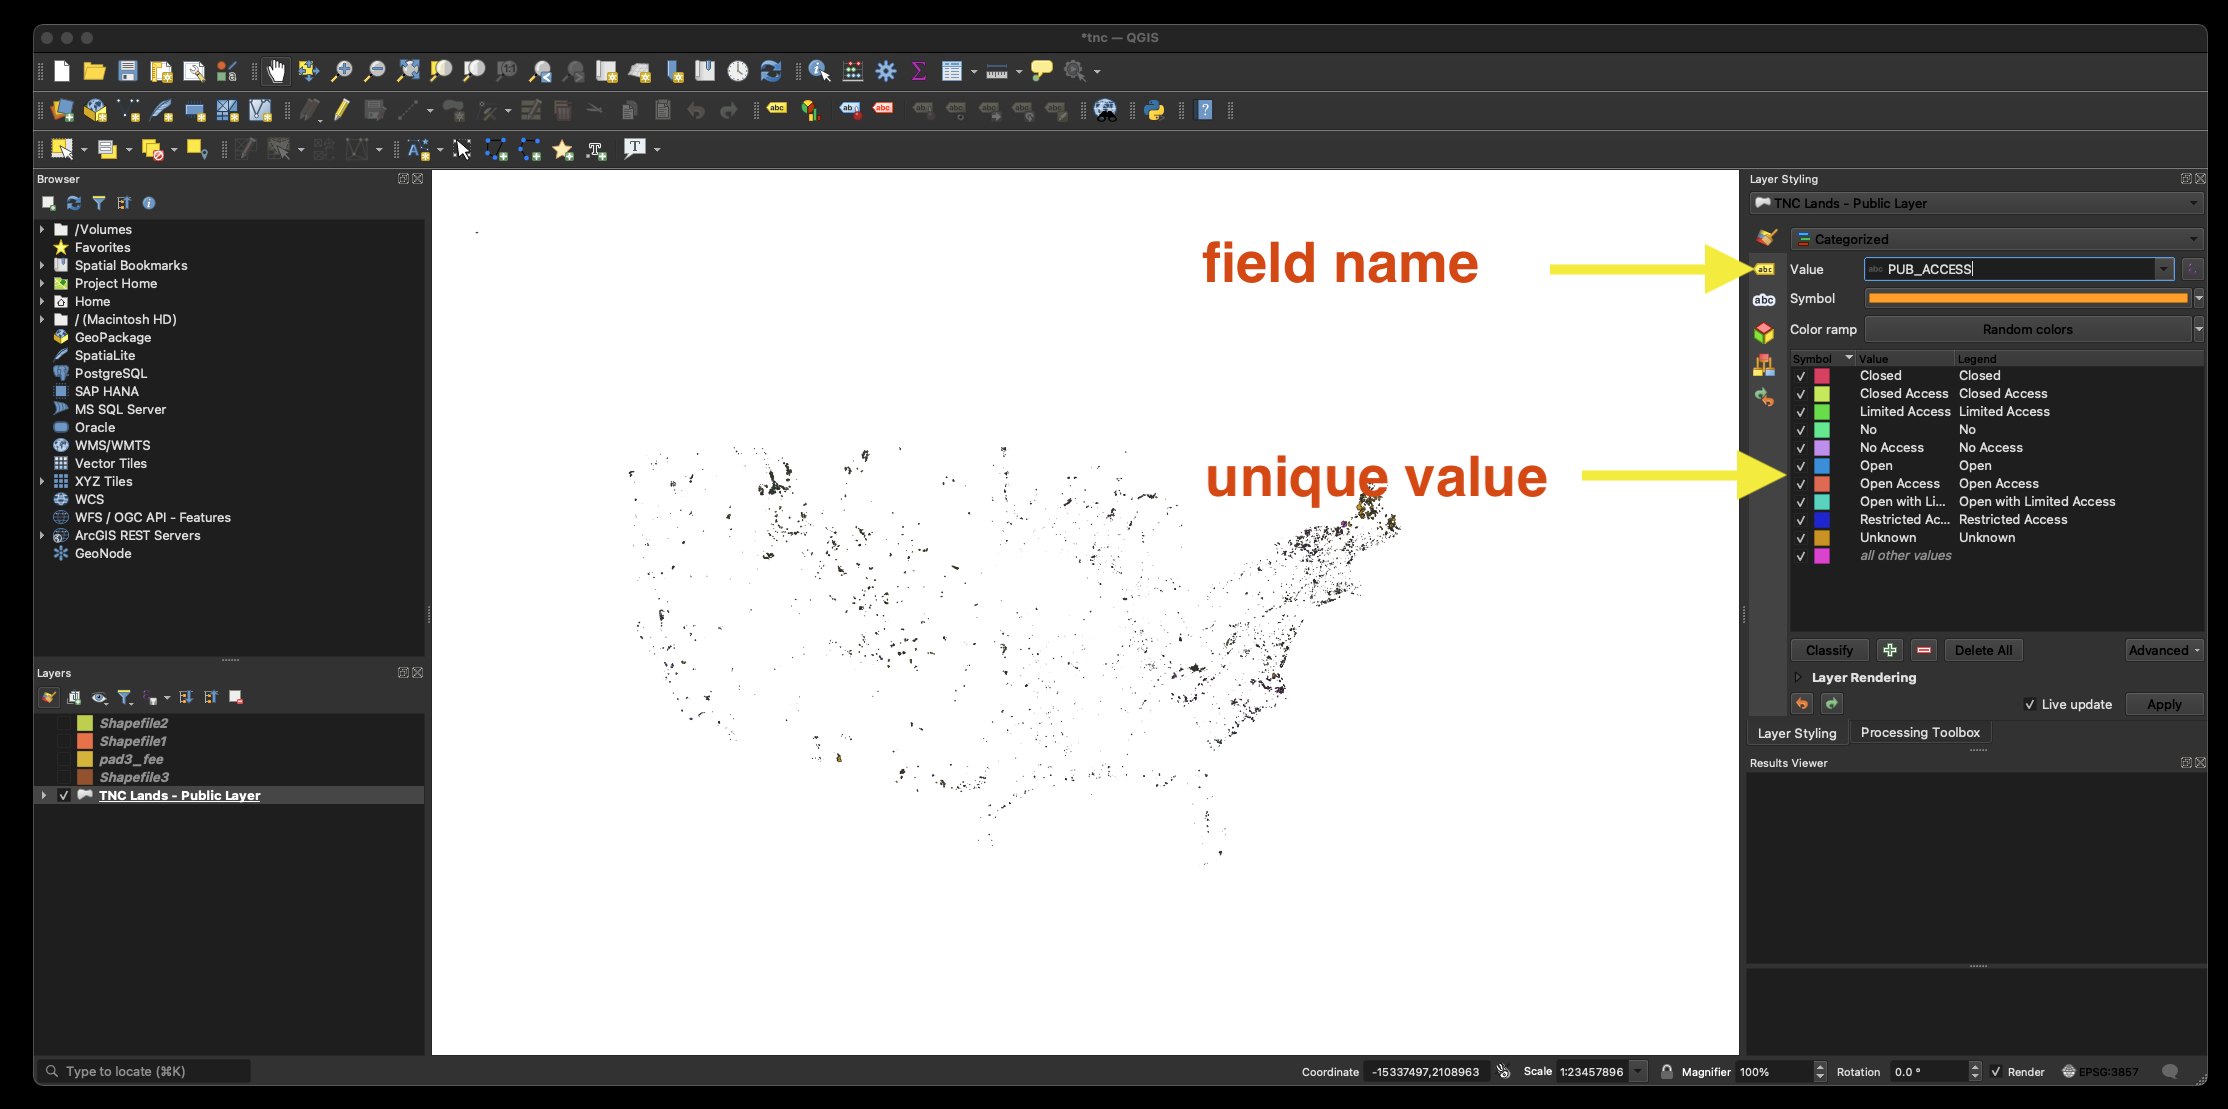
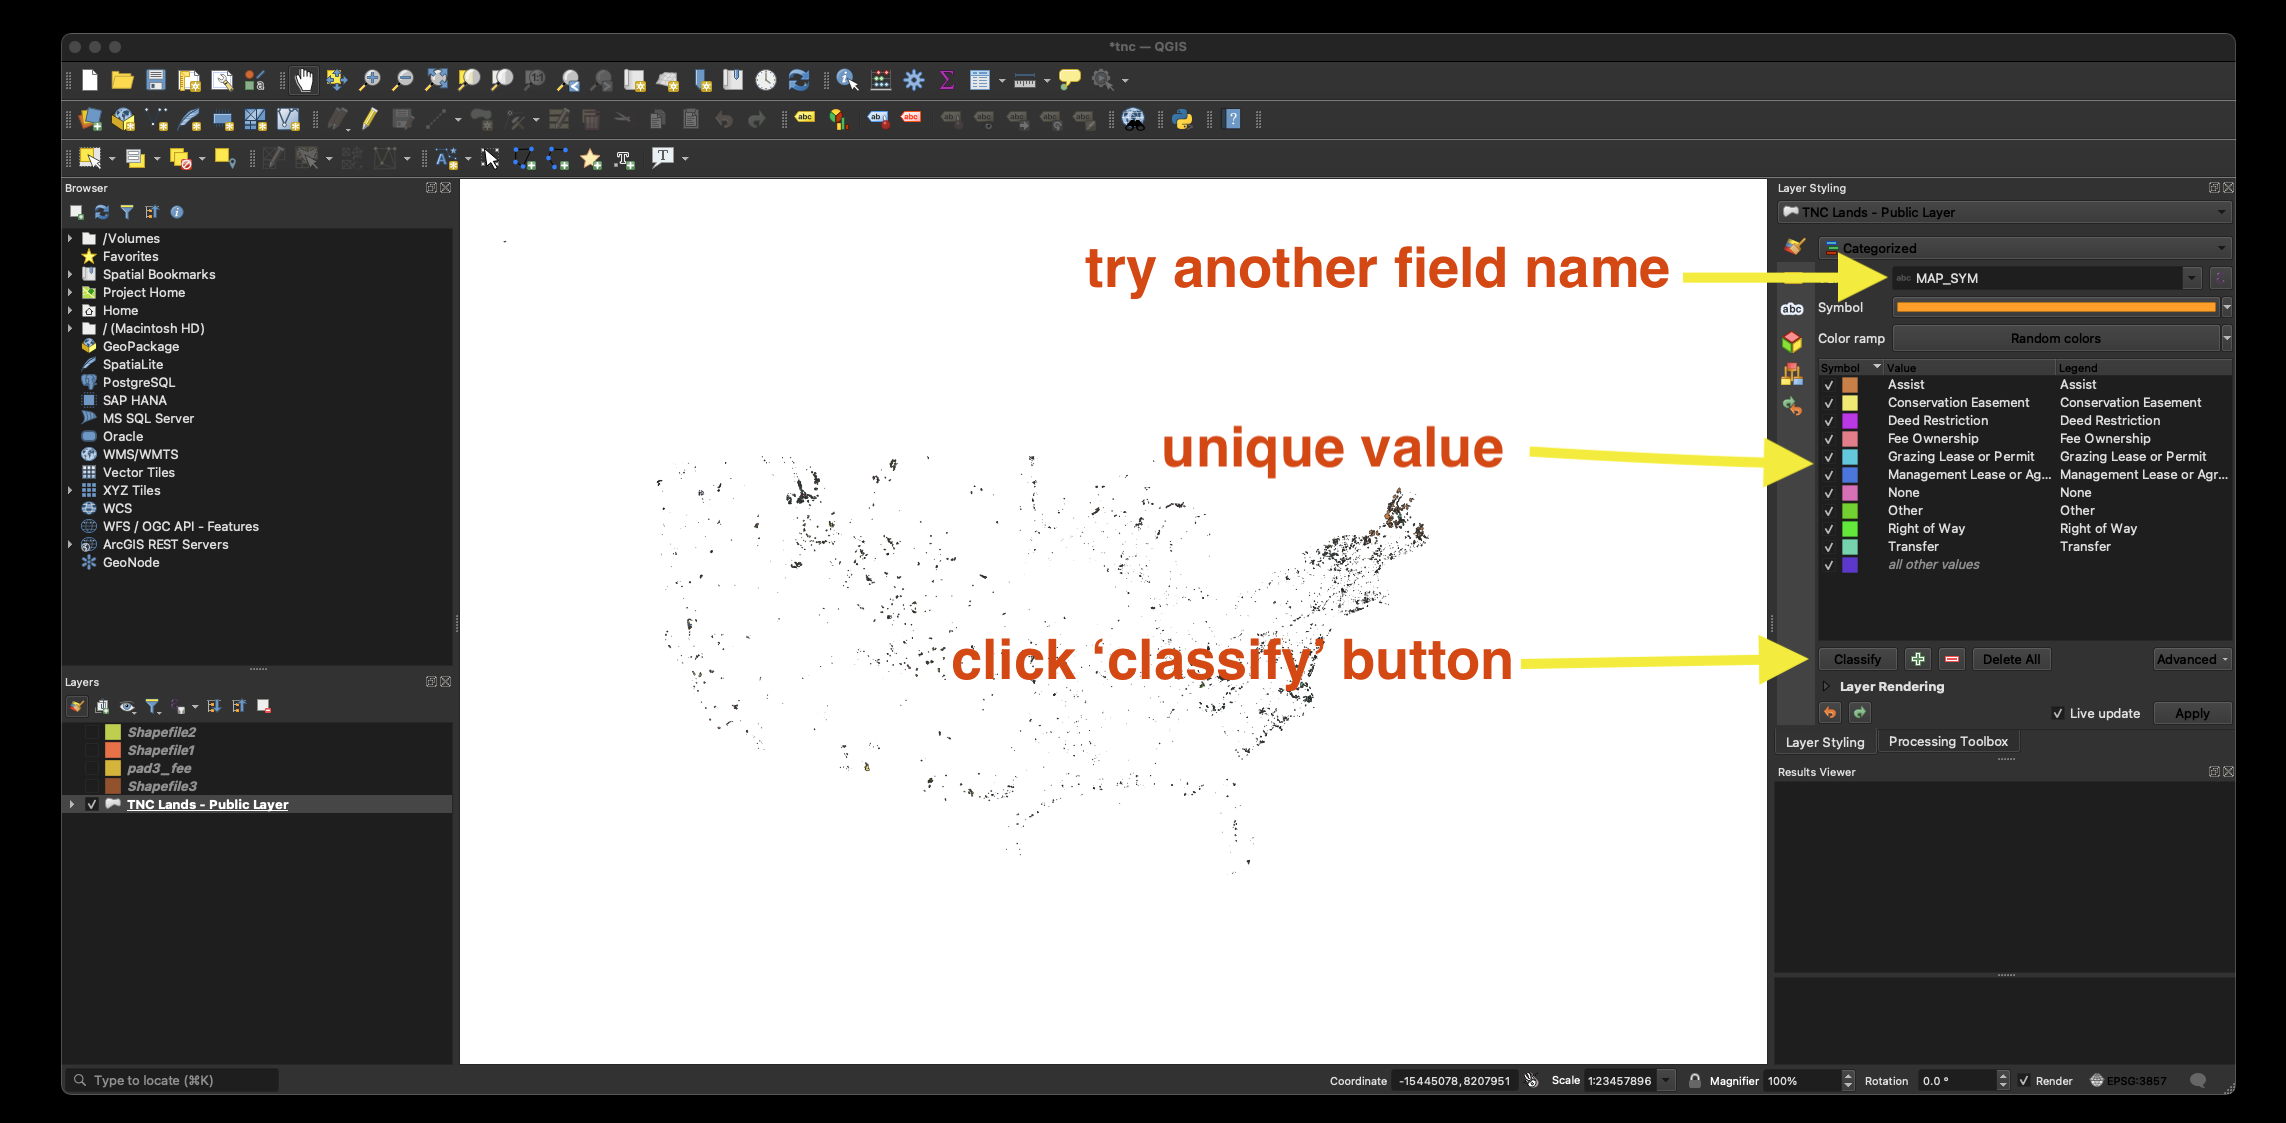
3) Use unique value in symbology
![](https://transparentgov.net/data/img3/tnc_300.png)
![](https://transparentgov.net/data/img3/tnc_301.png)
![](https://transparentgov.net/data/img3/tnc_302.png)
![](https://transparentgov.net/data/img3/tnc_303.png)
![](https://transparentgov.net/data/img3/tnc_304.png)
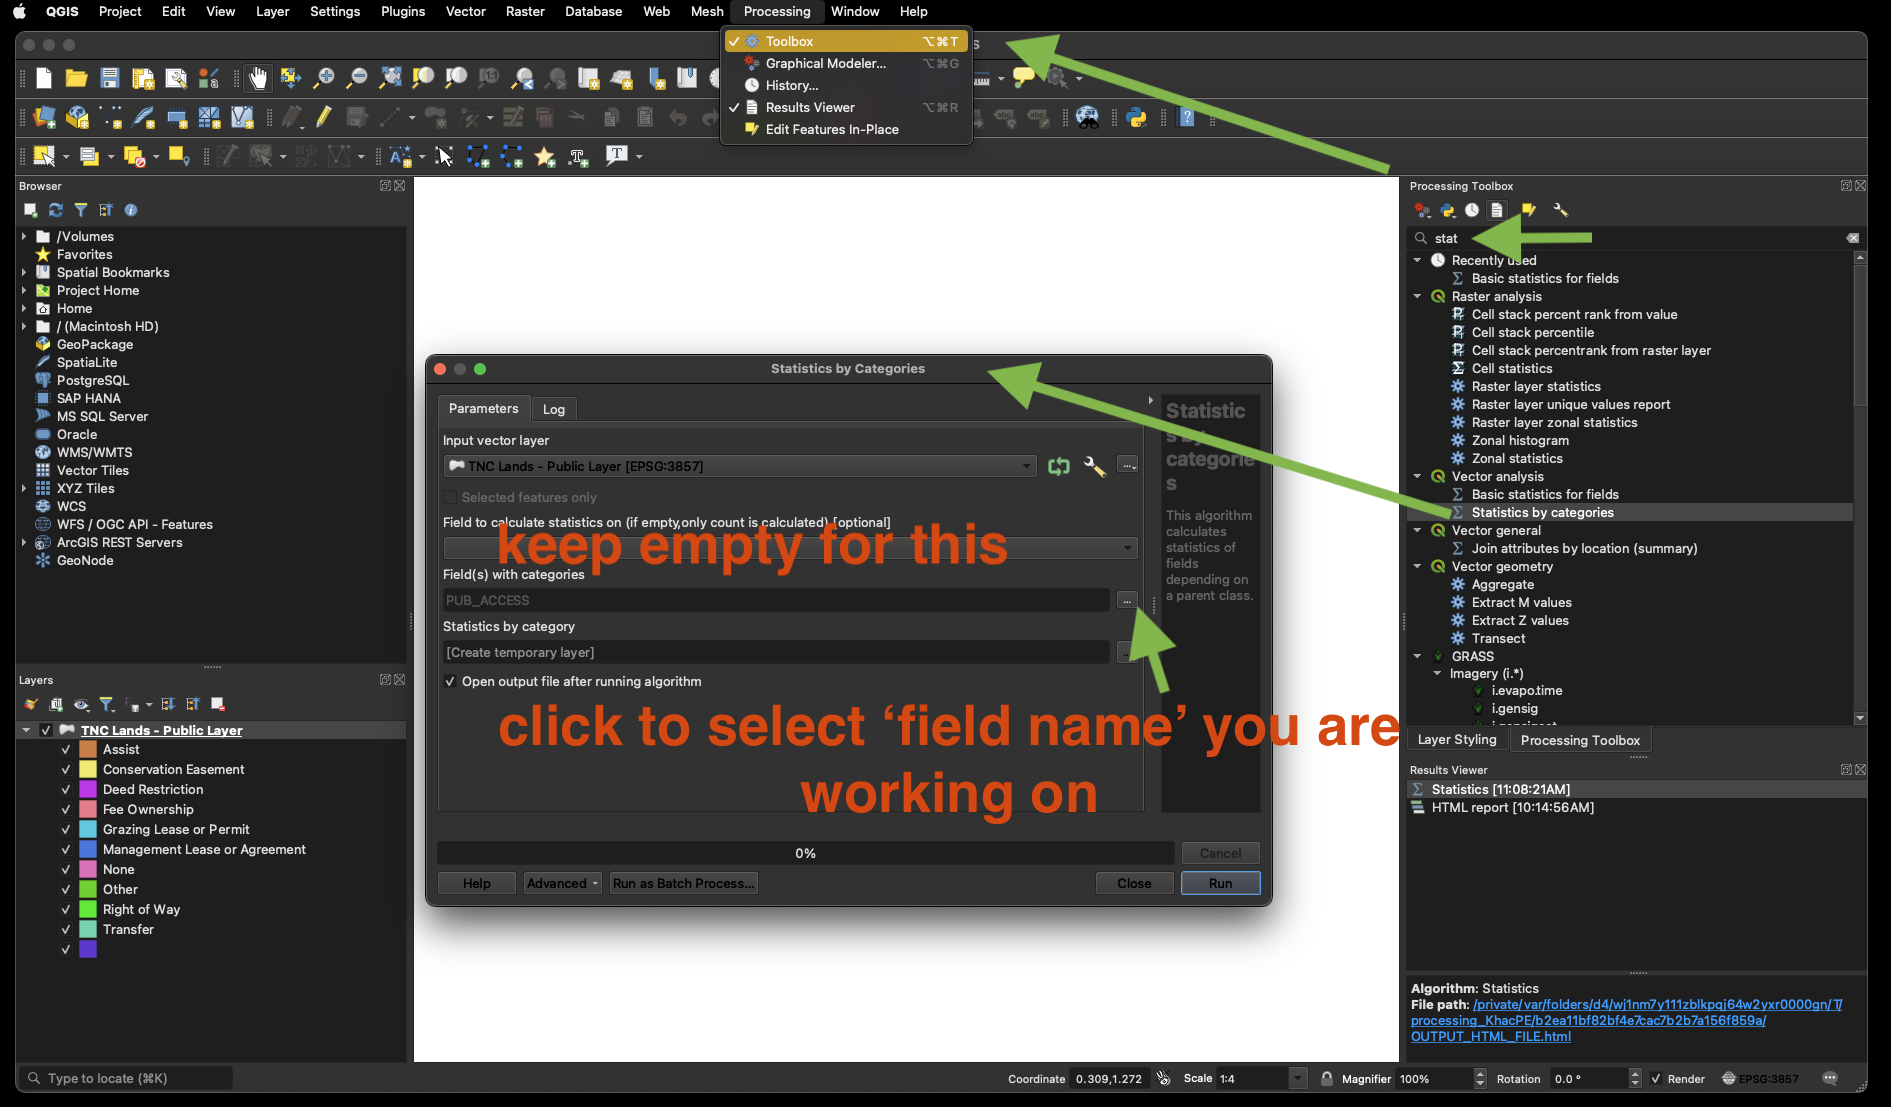
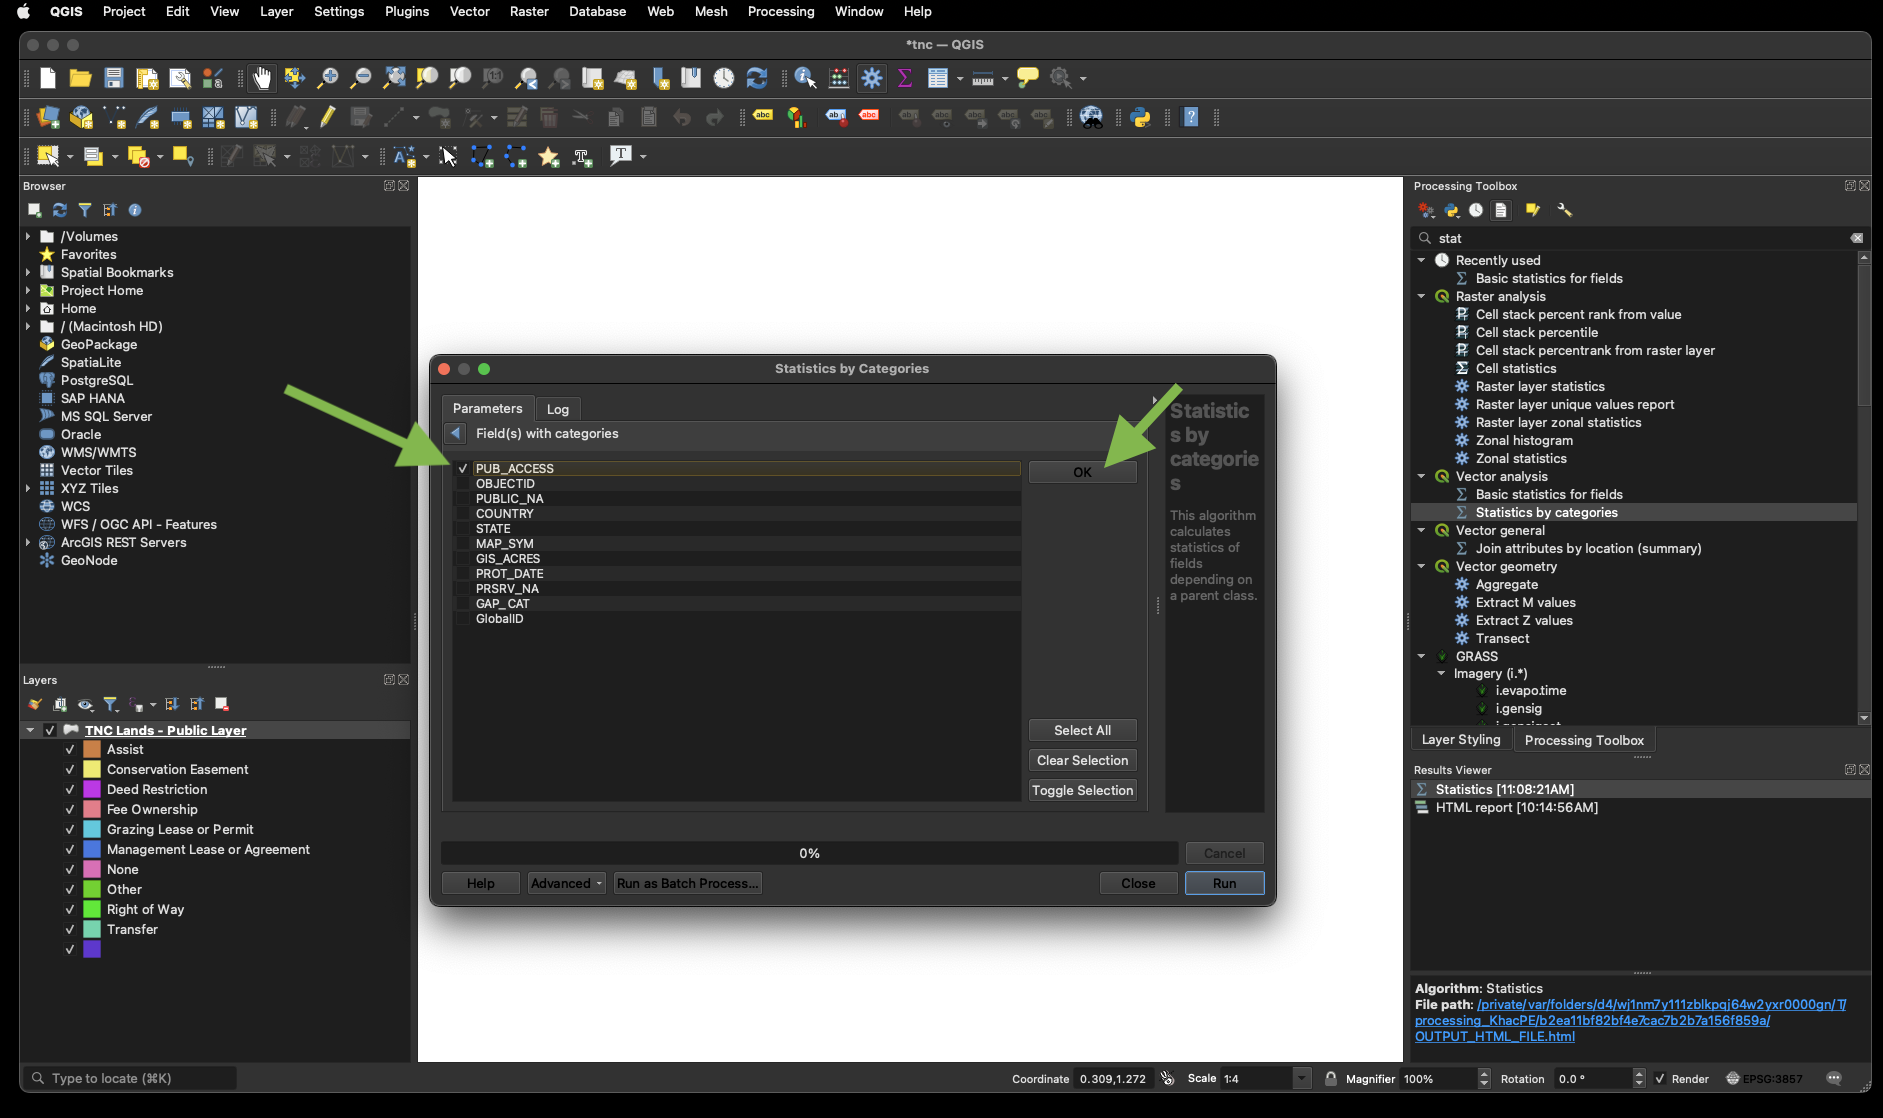
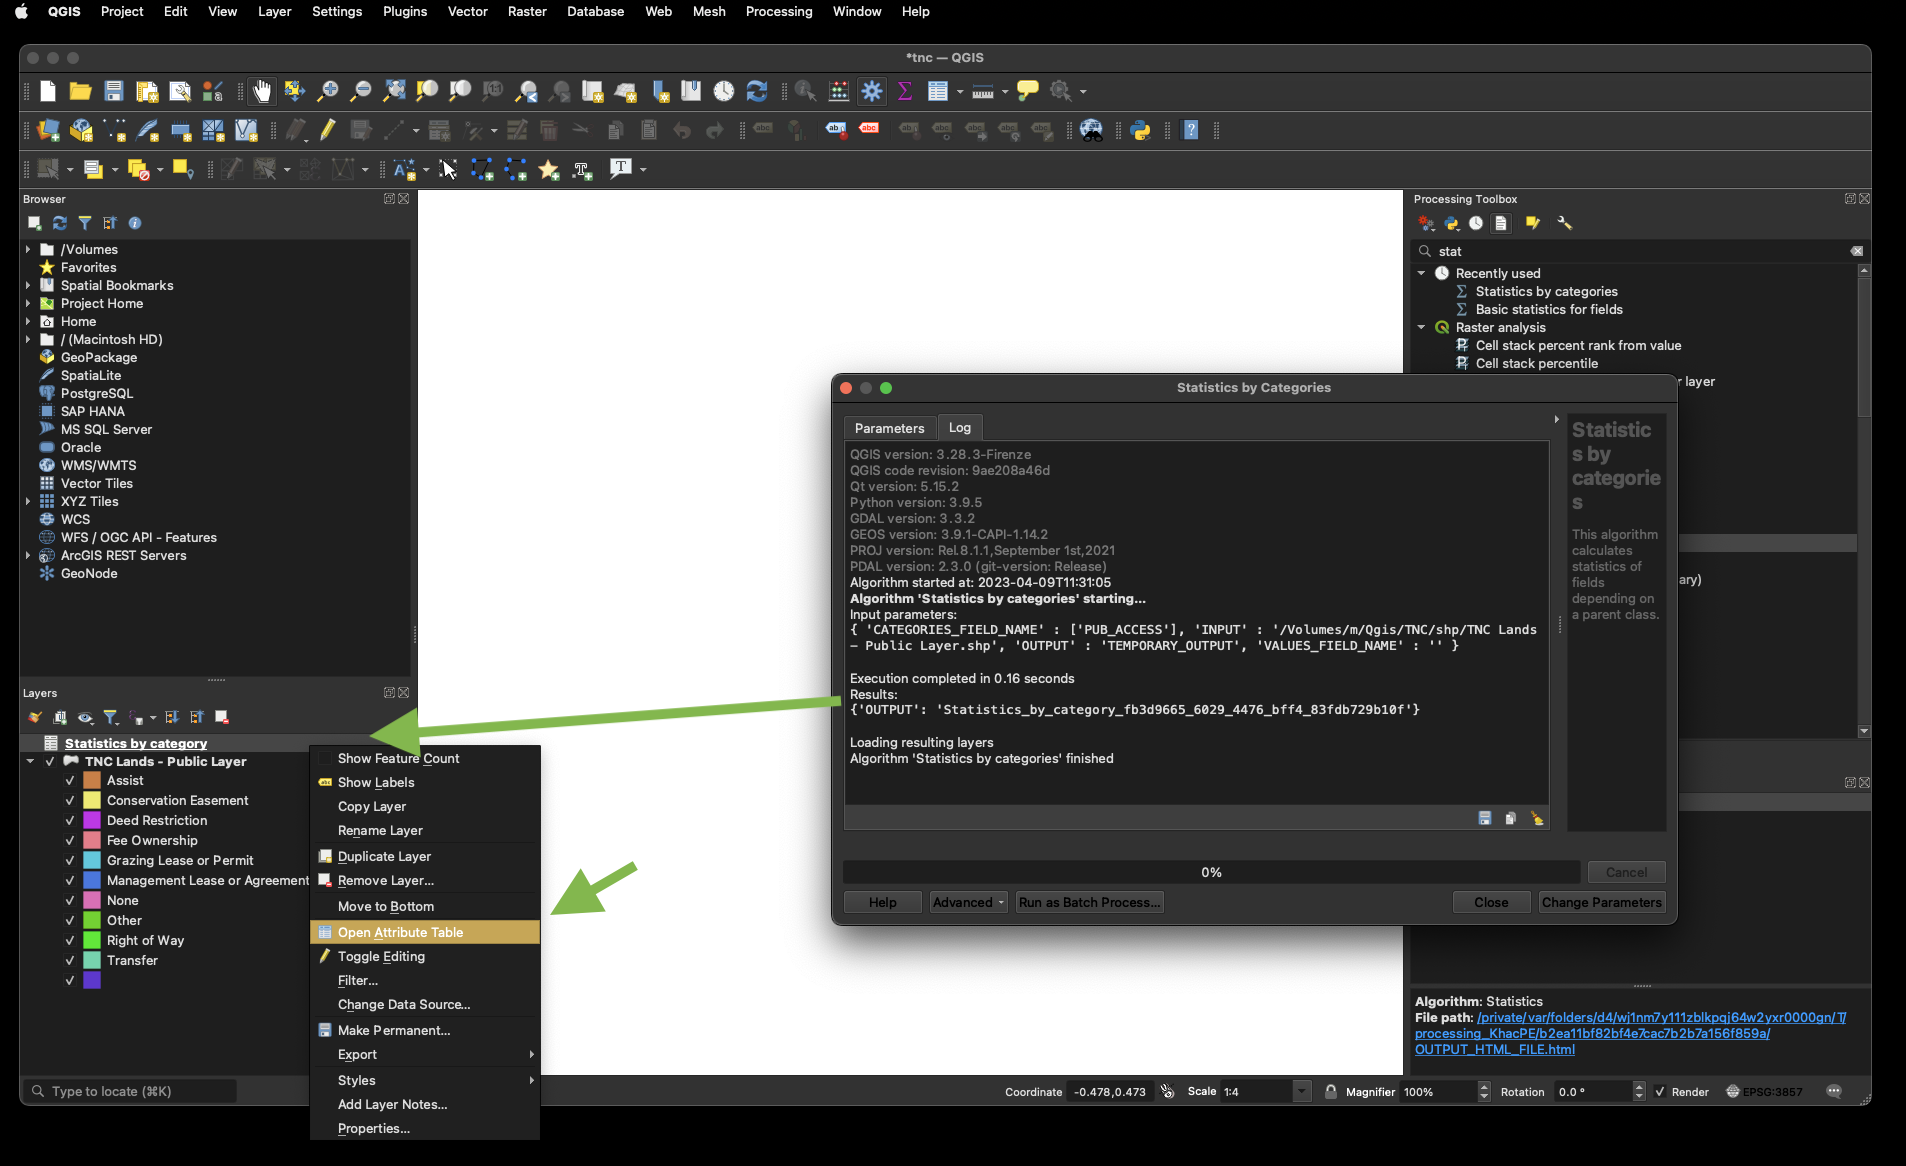
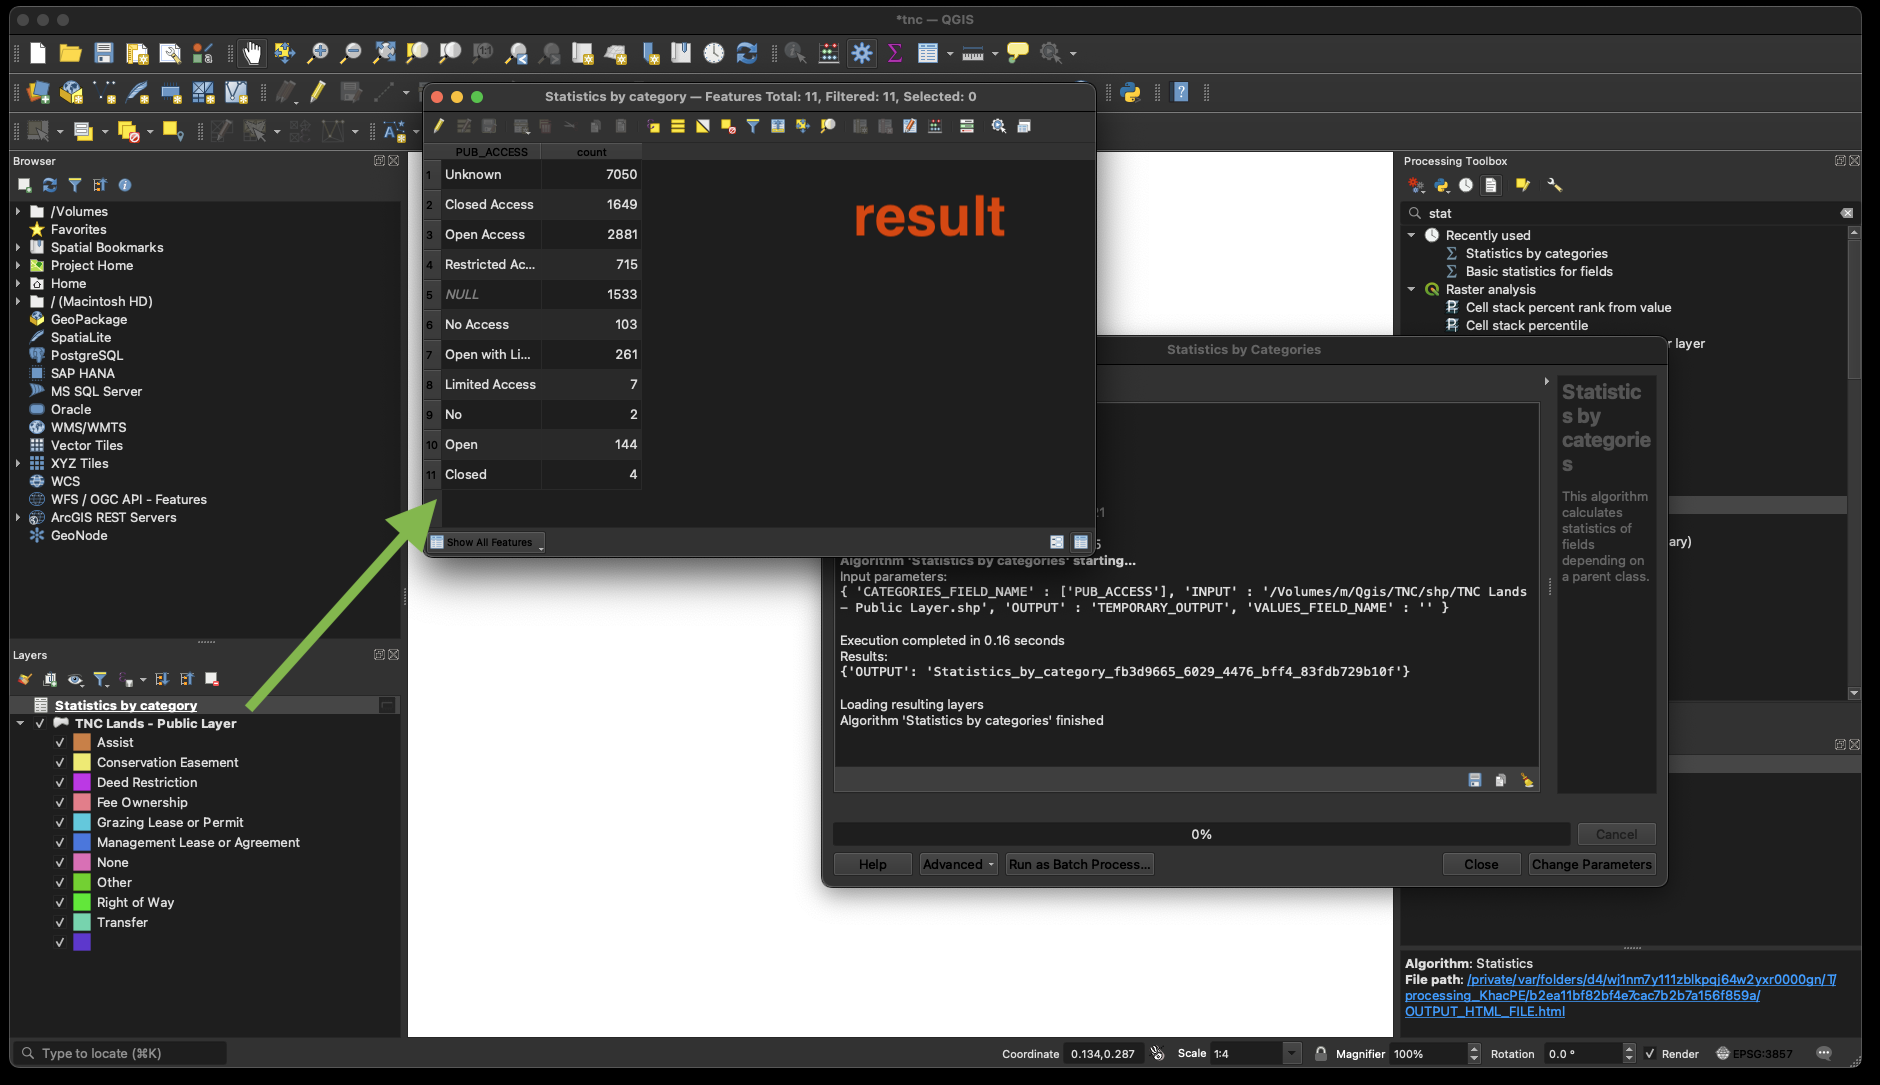
4) Use statistics by categories best for most people
![](https://transparentgov.net/data/img3/unique_10.png)
![](https://transparentgov.net/data/img3/unique_11.png)
![](https://transparentgov.net/data/img3/unique_12.png)
![](https://transparentgov.net/data/img3/unique_13.png)
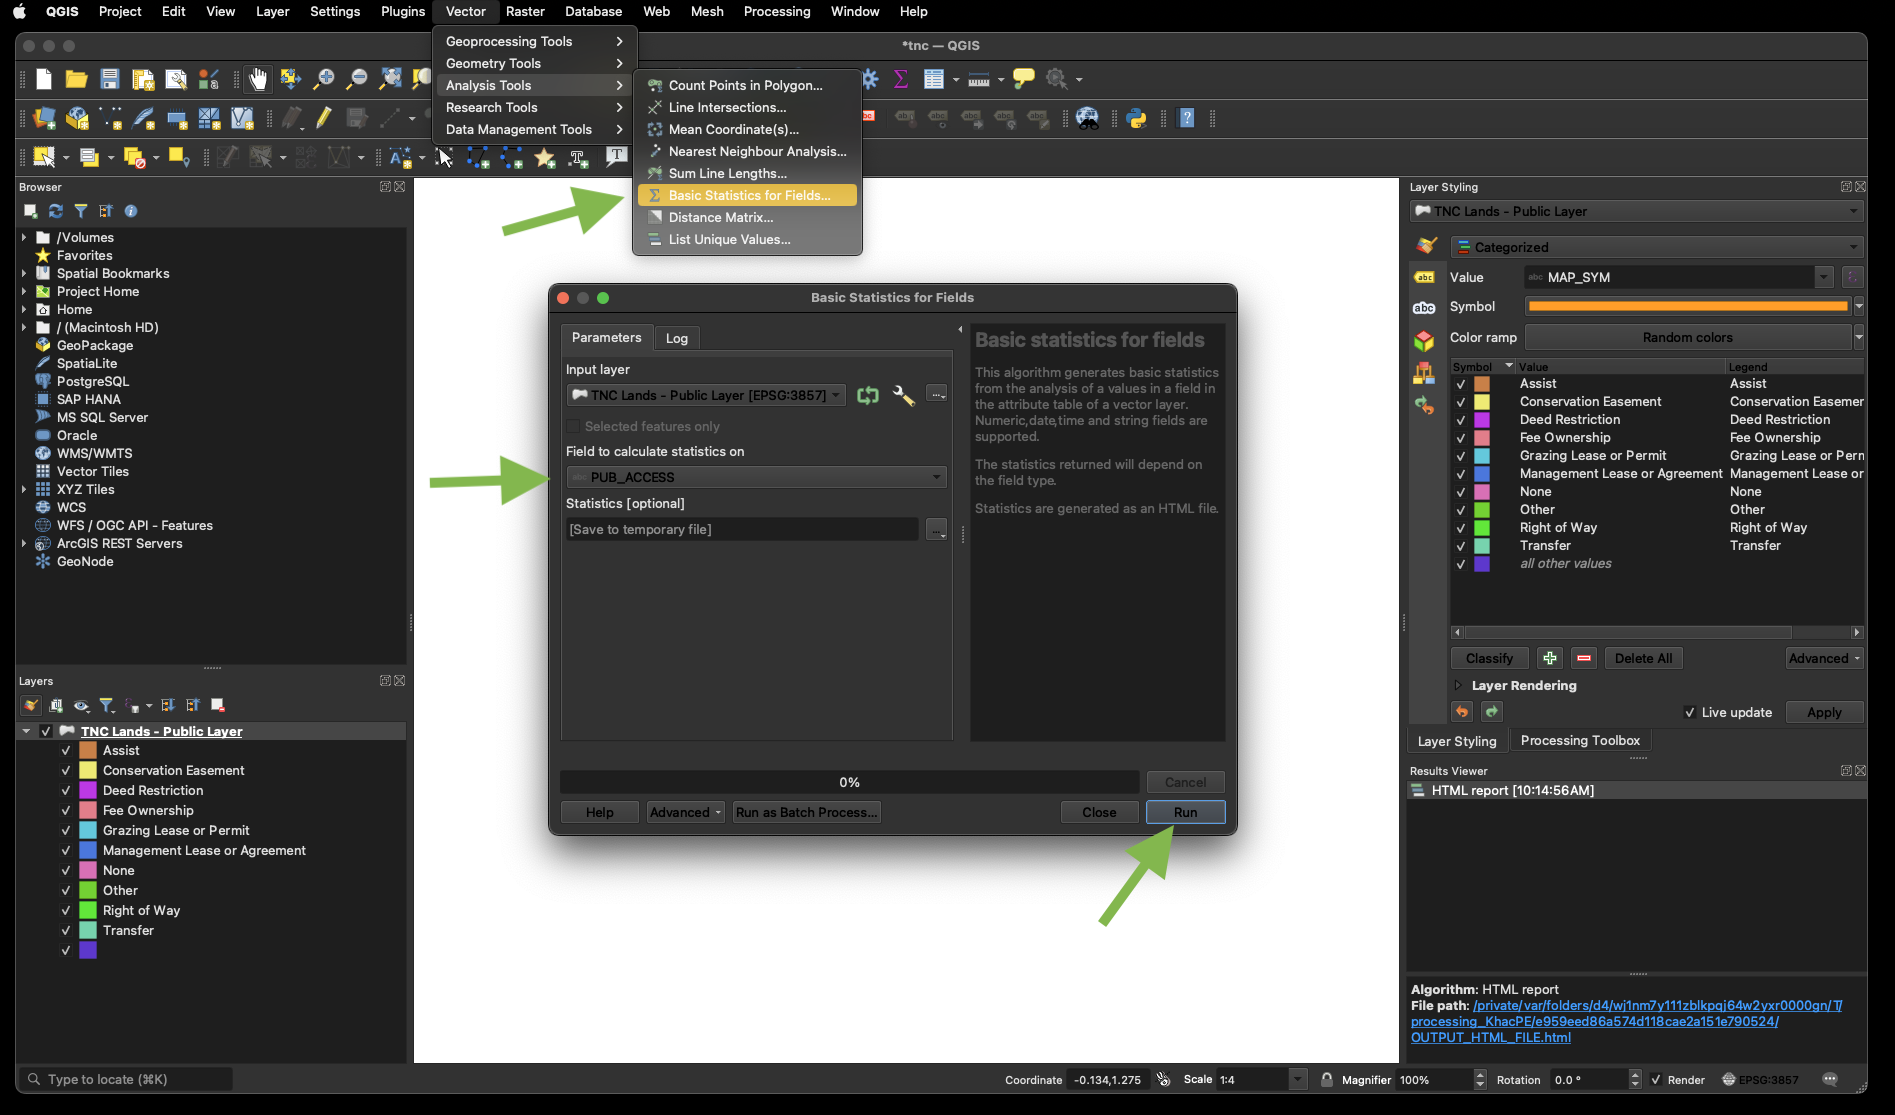
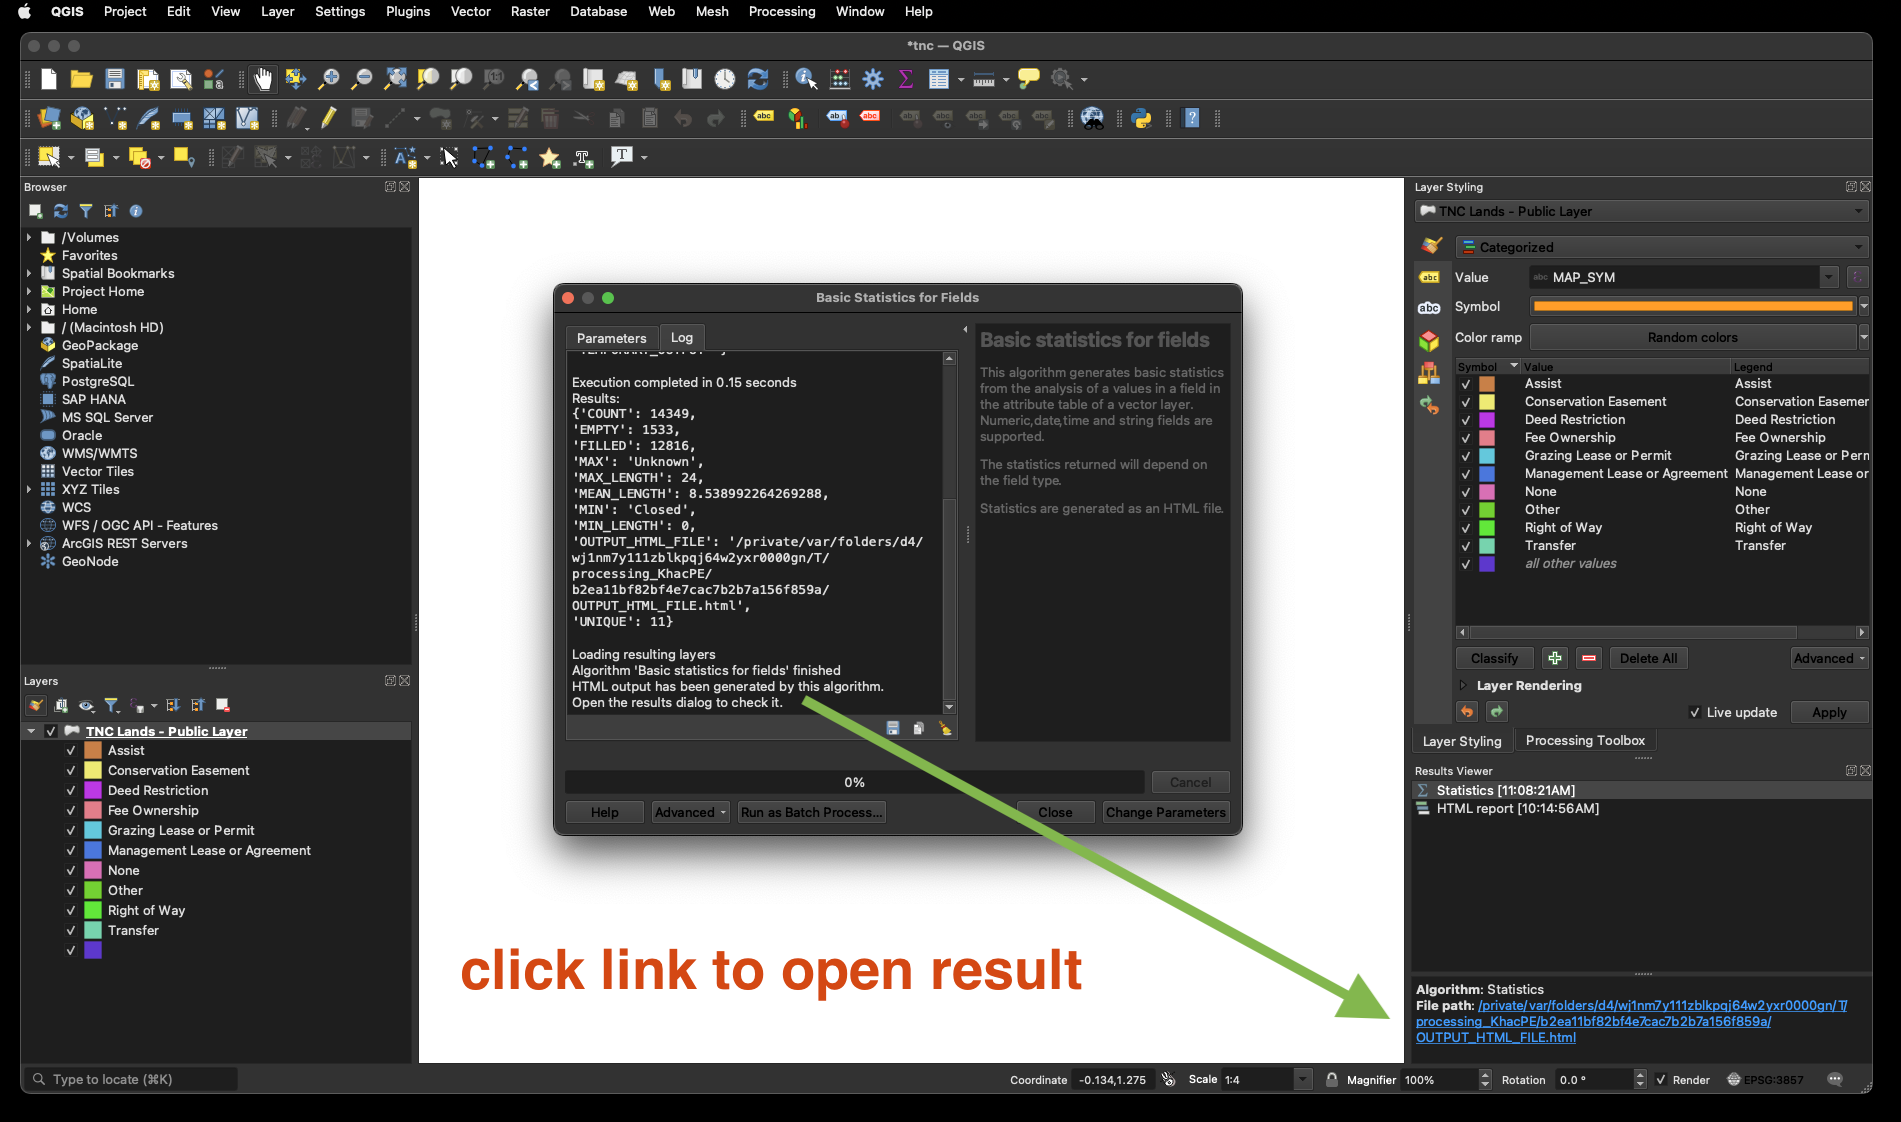
5) Use statistic for fields
![](https://transparentgov.net/data/img3/unique_8.png)
![](https://transparentgov.net/data/img3/unique_9.png)